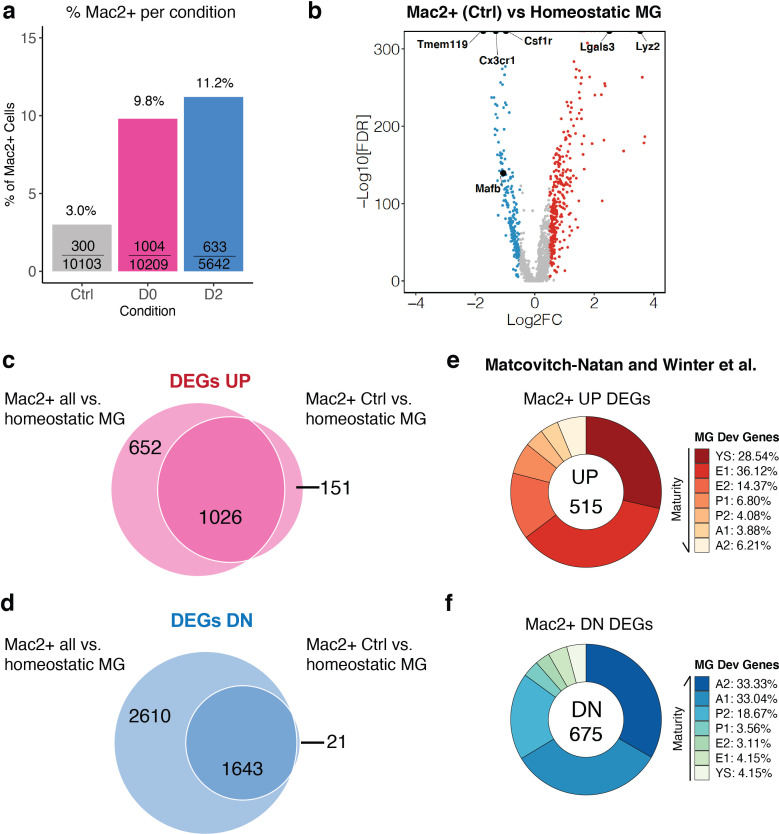
Figure 7. MAC2+ cells are present in naïve adult mouse brains and display immature microglial markers.
(a) Bar graph showing the relative frequency of MAC2+ cells among all cells within each treatment group. The fraction inside each bar shows the number of MAC2+ cells within the treatment group (numerator) over the total number of cells within that treatment group (denominator). (b) Volcano plot showing differentially expressed genes (DEGs) of MAC2+ cells from Ctrl samples in comparison to homeostatic microglia (Cluster-2). Upregulated DEGs are colored in red while downregulated DEGs are colored in blue (log fold change >0.5 or<−0.5). Genes of interest are highlighted in text. (c) Venn diagram showing the common upregulated DEGs found between all MAC2+ cells (left circle) and MAC2+ cells from Ctrl samples (right circle). (d) Venn diagram showing the common downregulated DEGs found between all MAC2+ cells (left circle) and MAC2+ cells from Ctrl samples (right circle). (e,f) Donut chart showing the percentage of upregulated DEGs (e) and downregulated DEGs (f) in MAC2+ cells from Ctrl samples overlapping with developmental marker genes identified in Matcovitch-Natan and Winter et al.

