
Author response image 1. Ridge plot shows Comparison of expression levels of CD74 and MHCs in clusters1–5.
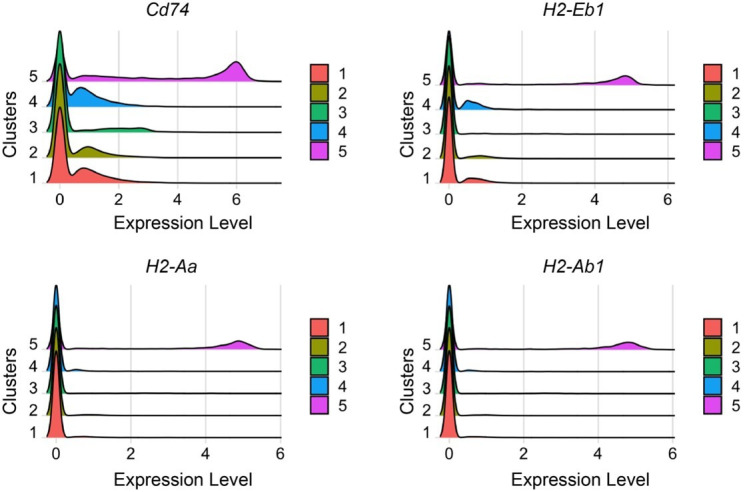
Cells in cluster 5 have the highest levels of CD74, H2-Eb1, H2-Aa and H2-Ab1. Among them, CD74 exhibit the highest level.
Official websites use .gov
A
.gov website belongs to an official
government organization in the United States.
Secure .gov websites use HTTPS
A lock (
) or https:// means you've safely
connected to the .gov website. Share sensitive
information only on official, secure websites.
Cells in cluster 5 have the highest levels of CD74, H2-Eb1, H2-Aa and H2-Ab1. Among them, CD74 exhibit the highest level.