. 2020 Oct 20;9:e57101. doi: 10.7554/eLife.57101

Figure 1. Post-mating GSC increase requires Oamb in the escort cells.

(A) A schematic representation of Drosophila germarium. GSCs reside in a niche consisting of somatic cells such as cap cells, terminal filament cells, and escort cells and are identifiable by their stereotypical spectrosome morphology and location (adjacent to cap cells). GSC division produces one self-renewing daughter and one cystoblast (CB) that differentiates into a germline cyst. (B) Representative images of wild-type (w1118) female adult germariums, containing 1, 2 and 3 GSCs from top to bottom. The samples were stained with monoclonal antibody 1B1 (green) and anti-DE-cadherin (magenta), which stain the spectrosome and overall cell membranes, respectively. GSCs are indicated by asterisk. Scale bar, 20 µm. (C–D) Frequencies of germaria containing 1, 2, and 3 GSCs (left vertical axis) and the average number of GSCs per germarium (right vertical axis) in virgin (V) and mated (M) female flies. c587>+ flies were used as the control in D. (E) The ratio of pH3+ GSCs per total GSCs. (F) The ratio of apoptotic (Dcp-1+) somatic cells and germ cells per germarium. c587>+ flies were used as the control. (G) Representative images of adult female germaria immunostained with anti-pMad antibody (green) and DAPI (blue) are shown. GSCs are outlined with dotted lines. Scale bar, 10 µm. (H) Quantification of relative pMad intensity levels in the GSCs (i.e. virgin (V), mated (M)) as normalized to the pMad intensity in CBs. Each sample number was at least 25. The three horizontal lines for each sample indicate lower, median, and upper quartiles. (I) The number of cap cells per germarium in the control and Oamb RNAi driven by c587-GAL4. Values on the y-axis are presented as the mean with standard error of the mean. c587>+ flies were used as the control. For C-F, and I the number of germaria analyzed is indicated inside the bars. Wilcoxon rank sum test with Holm’s correction was used for C, D, H, and I. Fisher’s exact test with Holm’s correction was used for E and F. ***p≤0.001, **p≤0.01, and *p≤0.05; NS, nonsignificant (p>0.05). All source data are available in Source data 1 and 2.

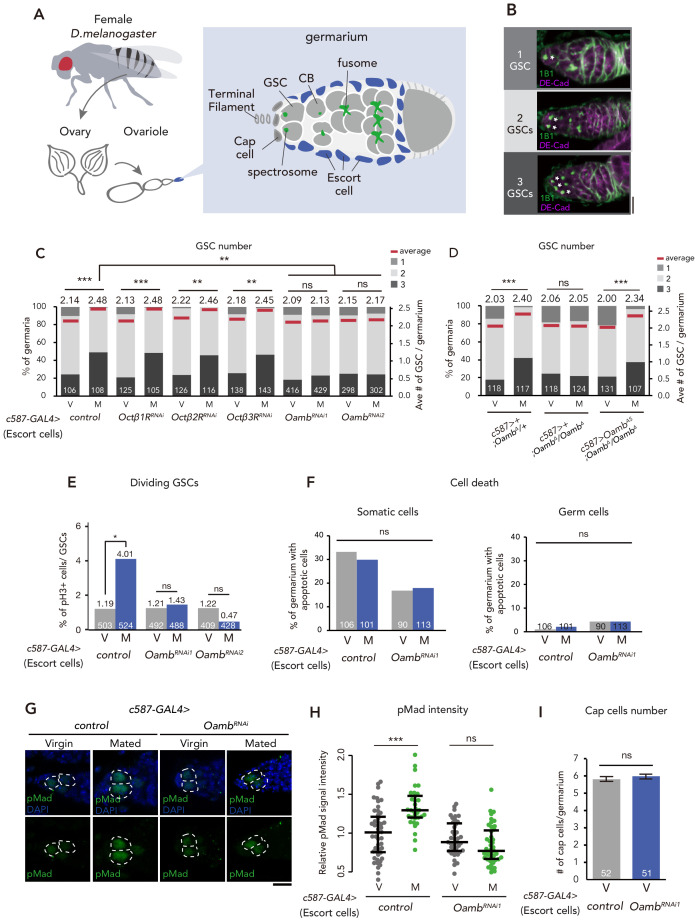
Figure 1.

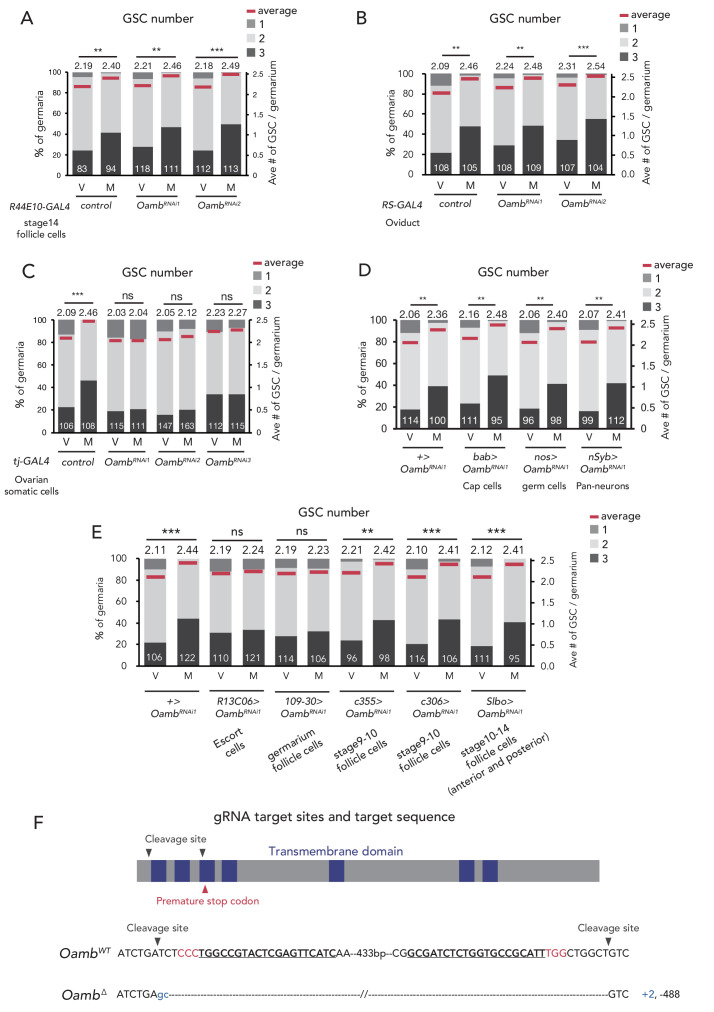
Figure 1—figure supplement 1. Oamb acts in the escort cells for post-mating GSC increase.

Figure 1—figure supplement 1.

(A–E) Frequencies of germaria containing 1, 2, and 3 GSCs (left vertical axis) and the average number of GSCs per germarium (right vertical axis) in virgin (V) and mated (M) female flies in (A) Oamb RNAi in mature follicle cells by (R44E10-GAL4); (B) Oamb RNAi in the oviduct (by RS-GAL4); (C) Oamb RNAi by tj-GAL4; (D) Oamb RNAi in cap cells (by bab-GAL4), nervous system (by nSyb-GAL4), and germ cells (by nos-GAL4); and (E) Oamb RNAi in escort cells (by R13C06-GAL4), follicle cells in germarium (by 109–30 GAL4), and stage 9–10 follicle cells (by c355-GAL4 and c306-GAL4), late stage follicle cells and border cells (slbo-GAL4); The number of germaria analyzed is indicated inside the bars. (F) A schematic representation of gRNA target sites (cleavage sites: gray arrowhead) and premature stop codon (red arrowhead) in coding sequences of Oamb genes. Regions of the putative transmembrane domains of Oamb are highlighted in blue. The target locus in Cas9-induced mutant was PCR-amplified and sequenced. The WT sequence is shown on the top of sequences as reference. The Cas9-gRNA target sequence is underlined with the PAM indicated in red. Inserted nucleotides are indicated in light blue lowercase letters. The indel size is shown next to the sequence. The indel mutation results in a premature stop codon. Wilcoxon rank sum test was used for A-E. ***p≤0.001 and **p≤0.01; NS, non-significant (p>0.05). All source data are available in Source data 1.

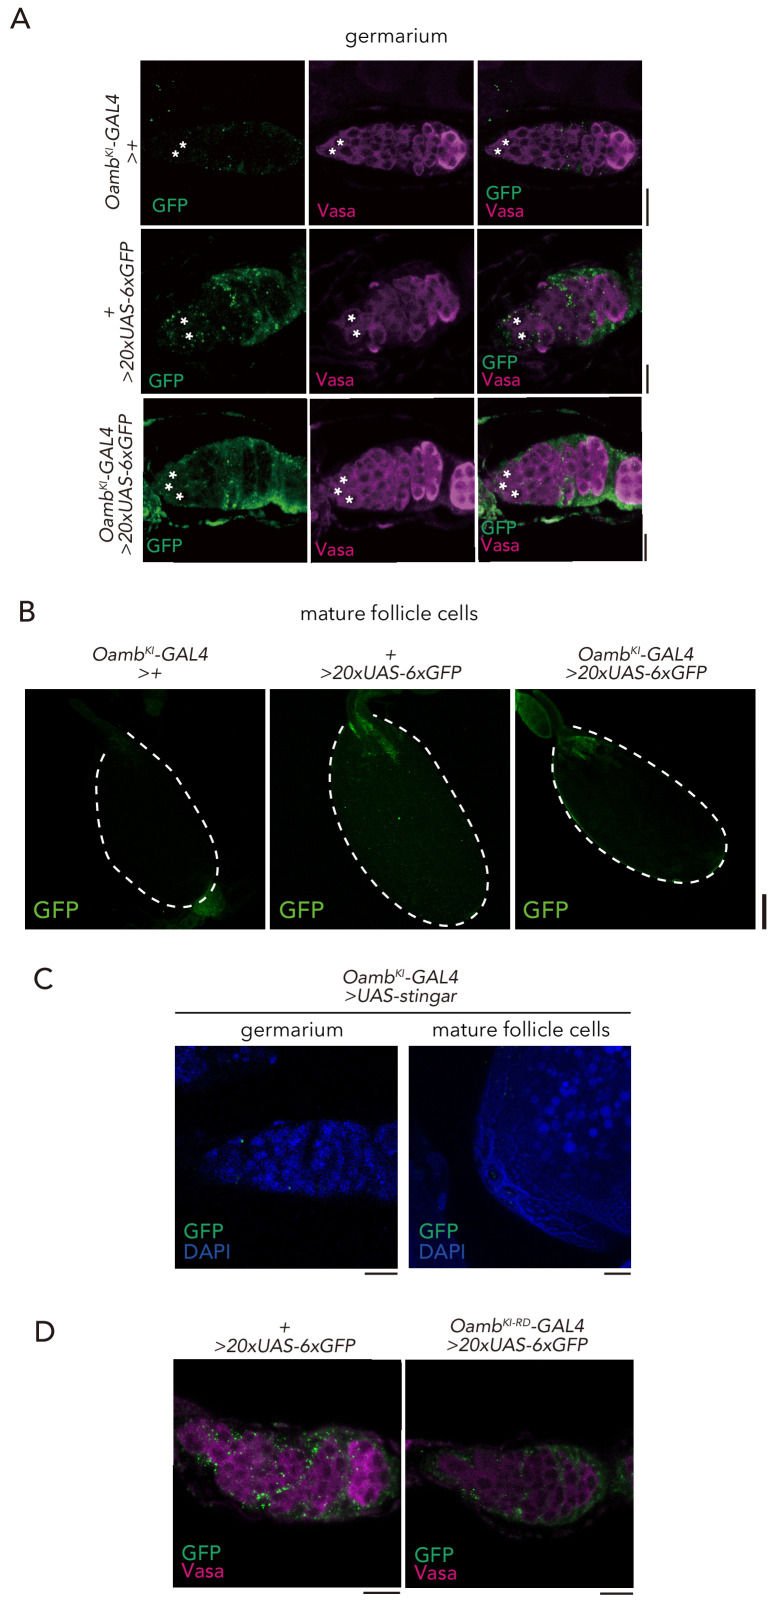
Figure 1—figure supplement 2. Expression of Oamb knock-in GAL4.

Figure 1—figure supplement 2.

(A–B) Immunofluorescence of germarium in adult female flies expressing 20xUAS-6xGFP reporter under OambKI-T2A-GAL4. The GSCs are indicated by asterisk. Note that 20xUAS-6xGFP has leak signal in the germarium even in the control (+ > 20xUAS-6xGFP). Scale bar, 20 µm. (B) Immunofluorescence of stage 14 egg chamber expressing 20xUAS-6xGFP reporter under OambKI-T2A-GAL4. Note that GFP expression was not observed in the stage 14 egg chamber. Scale bar, 100 µm. (C) Immunofluorescence of germarium (left) and posterior follicle cells of stage 14 egg chamber (right) in adult female flies expressing UAS-Stinger reporter under OambKI-T2A-GAL4. Note that GFP signal is not detected in the germarium and stage 14 egg chamber. Scale bar, 20 µm. (D) Immunofluorescence of germarium in adult female flies expressing 20xUAS-6xGFP reporter under OambKI-RD-T2A-GAL4. Scale bar, 20 µm.

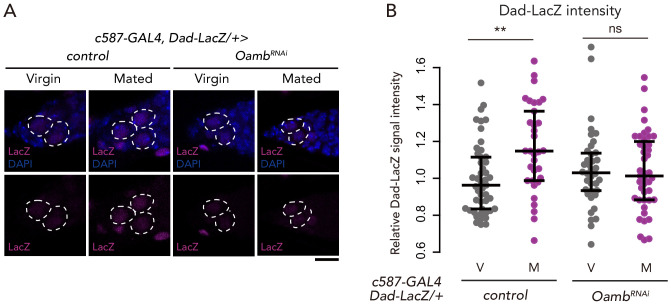
Figure 1—figure supplement 3. Oamb in the escort cells is necessary on mating-induced BMP signaling increase.

Figure 1—figure supplement 3.

(A) Representative images of adult female germaria immunostained with anti-LacZ antibody (magenta) and DAPI (blue) are shown. GSCs are outlined with dotted lines. Scale bar, 10 µm. (B) Quantification of relative Dad-LacZ intensity levels in the GSCs (i.e. virgin (V), mated (M)) as normalized to the Dad-LacZ intensity in CBs. Each sample number was at least 25. The three horizontal lines for each sample indicate lower, median, and upper quartiles. Wilcoxon rank sum test was used for B. **p≤0.01; NS, non-significant (p>0.05). All source data are available in Source data 2.