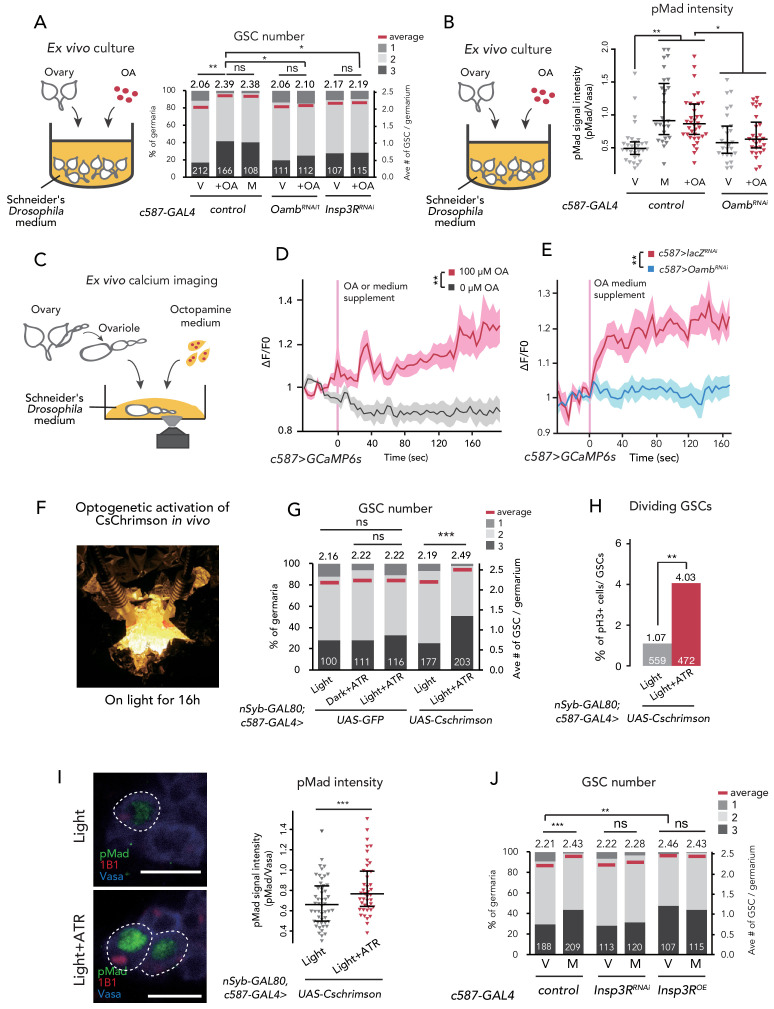
Figure 2. Ca2+ signaling is necessary for mating-induced GSC increase.
(A) Frequencies of germaria containing 1, 2, and 3 GSCs (left vertical axis) and the average number of GSCs per germarium (right vertical axis). The ovaries were dissected from virgin (V), mated (M), and virgin ovaries cultured with OA (+OA). c587>+ flies were used as the control. The number of germaria analyzed is indicated inside the bars. (B) Quantification of relative pMad intensity levels in the GSCs of ex vivo cultured ovaries (i.e. virgin (V), mated (M), and virgin cultured with OA (+OA)) as normalized to the pMad intensity in CBs. For the quantification of pMad intensity, the cell boundaries of GSCs and CBs were determined using anti-Vasa staining. Each sample number was at least 25. The three horizontal lines for each sample indicate lower, median, and upper quartiles. (C) A schematic representation of ex vivo calcium imaging. The dissected ovariole was incubated in Schneider’s Drosophila medium with or without OA. (D) Changes in the relative fluorescence intensity of GCaMP6s after 200 s without stimulation (n = 8) or with stimulation (n = 10) with 100 μM OA, and (E) with 100 μM OA as control (c587 >LacZRNAi, n = 8) and c587 >OambRNAi (n = 8) female ovaries. Note that OA significantly increased the calcium response in escort cells, but OambRNAi impaired the calcium response. Statistical analysis was done at 120 s. (F) Equipment setup for optogenetic activation of ChR. Flies were placed under the light for 16 hr before dissection. (G) Frequencies of germaria containing 1, 2, and 3 GSCs (left vertical axis) and the average number of GSCs per germarium (right vertical axis) with light, with light and all trans-retinal (ATR) or with dark and ATR. Germarium was dissected from virgin females. nSyb-GAL80; c587 >GFP flies were used as control. The number of germaria analyzed is indicated inside the bars. (H) The ratio of pH3+ GSCs and total GSCs. The number of GSCs analyzed is indicated inside the bars. (I, left) Representative images of adult female germaria immunostained with anti-pMad antibody (green), anti-1B1 antibody (red), and anti-Vasa antibody (germ cell marker; blue) are shown. GSCs are outlined with dotted lines. (I, right) Quantification of the relative pMad intensity in GSCs, which was normalized to that in CBs. For the quantification of pMad intensity, the cell boundaries of GSCs and CBs were determined using anti-Vasa staining. Each sample number is at least 30. The three horizontal lines for each data sample indicate lower, median, and upper quartiles. (J) Frequencies of germaria containing 1, 2, and 3 GSCs (left vertical axis) and the average number of GSCs per germarium (right vertical axis) in virgin (V) and mated (M) female flies. c587>+ flies were used as the control. The number of germaria analyzed is indicated inside the bars. Wilcoxon rank sum test with Holm’s correction was used for A, B, D, E, G, I, and J. Fisher’s exact test was used for H. ***p≤0.001, **p≤0.01, and *p≤0.05; NS, non-significant (p>0.05). All source data are available in Source data 1, 2, and 4.


