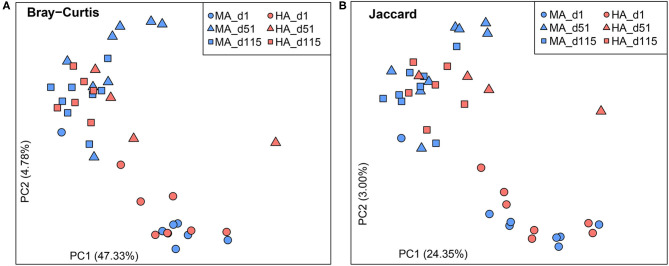
Figure 1.
Beta diversity plots of rumen microbiota in ewes grazing tall fescue pastures with high (HA) and moderate (MA) N. coenophialum infection. (A,B) Principal coordinate analysis (PCoA) plots based on the Bray-Curtis and Jaccard similarities. The treatments of MA and HA are differentiated by colors (blue and red), and sampling days (d1, d51 and d115) are distinguished by shape (circle, triangle, and square, respectively).

