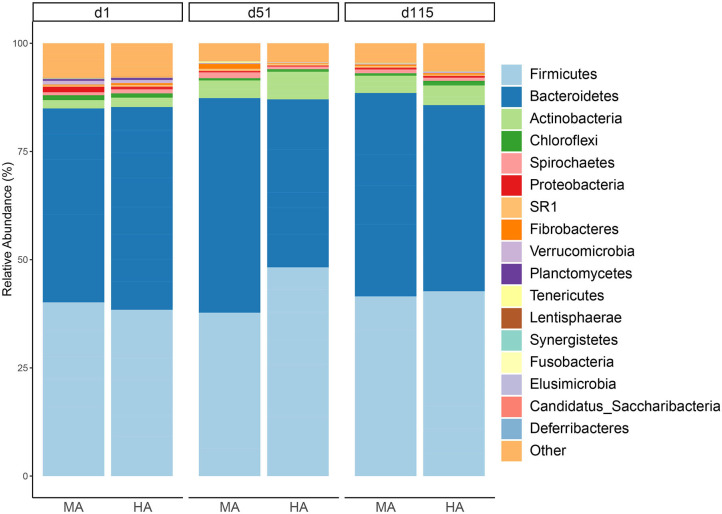
Figure 2.
Relative abundance of rumen phyla from ewes consuming tall fescue infected with moderate (MA) or high (HA) levels of N. coenophialum on days 1 (d1), 51 (d51), and 115 (d115). Average relative abundance for each phylum by treatment and sampling time. Each color represents the relative abundance of a bacterial taxon on the stacked bar chart.

