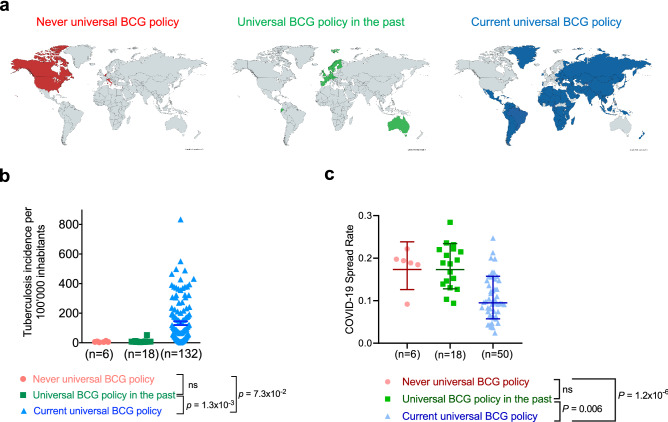
Figure 1.
COVID-19 spread rate in countries with distinct national BCG vaccination policy. (a) World maps show countries that never had a national BCG vaccination policy (in red), countries that had a universal BCG vaccination policy in the past (in green) and countries that currently have a universal BCG vaccination policy (in blue). (b) TB incidence per 100,000 inhabitants shown as mean ± SEM for all three groups of BCG policies (never (red), past (green) and current (blue) BCG vaccination policy). One-way ANOVA with Tukey posttest was performed. (c) CoV-2 spread rate is shown for all three groups of BCG policies (never (red), past (green) and current (blue) BCG vaccination policy). Data shown as median ± interquartile range. Maps were generated using the following website: https://mapchart.net/world.html.

