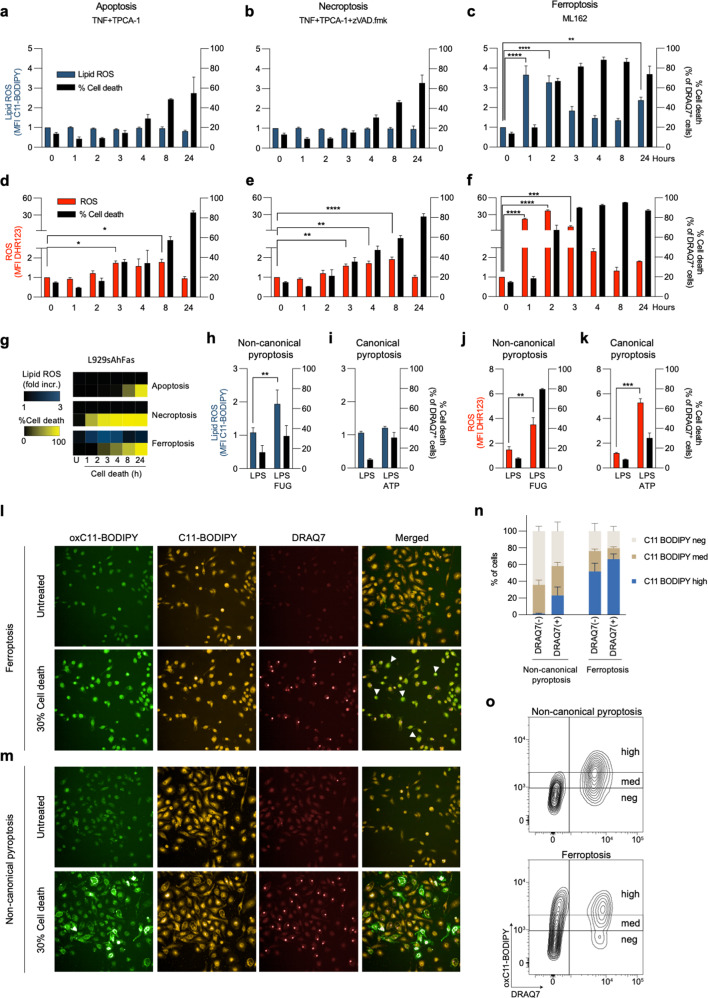
Fig. 2. Analysis of ROS and lipid ROS during apoptosis, necroptosis, ferroptosis, and pyroptosis.
a–c Lipid ROS production during apoptosis (4000IU/ml hTNF and 5 μM TPCA-1), necroptosis (4000IU/ml hTNF, 5 μM TPCA-1 and 10 μM zVAD.fmk) and ferroptosis (0.5 μM ML162) in BMDMs. d–f ROS levels during apoptosis, necroptosis, and ferroptosis in BMDMs. g Lipid ROS and cell death in L929sAhFas cells in different modes of RDC, heatmaps represent mean values from three independent experiments. h–i Lipid ROS during non-canonical (3 h of 1 µg/ml LPS followed by 8 h incubation after LPS transfection) and canonical (3 h of 1 µg/ml LPS followed by 30 min incubation with 5 mM ATP) pyroptosis. j–k ROS during canonical and non-canonical pyroptosis. l–m Representative fluorescent microscopy images of BMDMs undergoing ferroptosis and non-canonical pyroptosis reaching ~30% of cell death, oxC11-BODIPY (oxidized) represents the levels of lipid ROS, while C11-BODIPY represents the level of staining with the probe (unoxidized), DRAQ7 was used as a cell membrane permeabilization marker. n Analysis of C11-BODIPY signal intensity during ferroptosis and non-canonical pyroptosis based on flow cytometry experiments. o Representative contour plots during flow cytometry measurements of ferroptotic (3 h) and pyroptotic (8 h) BMDMs with stratification of the C11-BODIPY signal. All bars are mean ± SEM of at least three biological replicates. One-way ANOVA, *, p < 0.05, **p < 0.01, ***p < 0.001, ****p < 0.0001.

