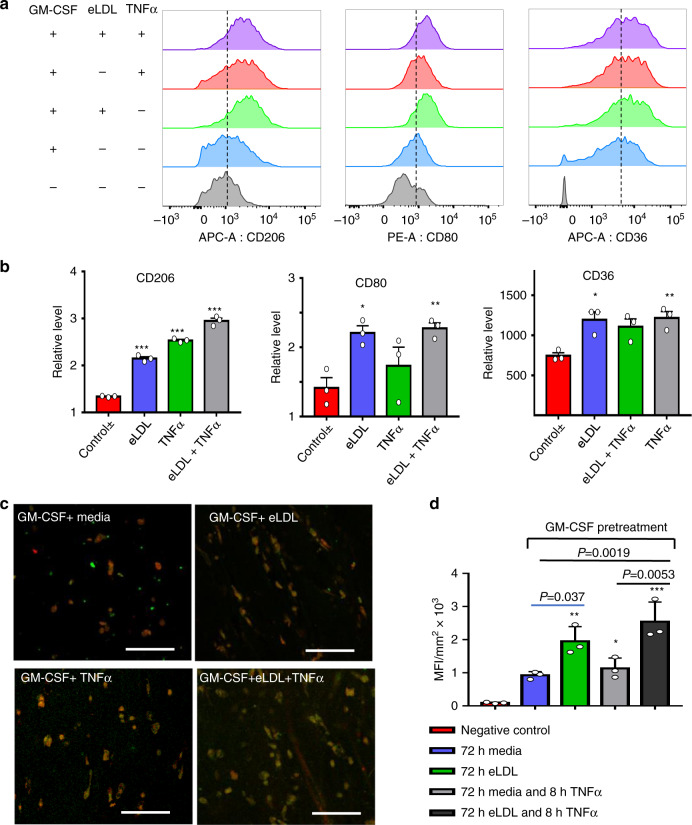
Fig. 7. Macrophage polarization in TEBVs after exposure to eLDL and/or TNFα.
a Flow cytometry of primary human monocyte differentiation into macrophages with eLDL ± TNFα treatment. b Quantification of the mean fluorescence intensity (MFI) of flow cytometry results. The relative level represents normalization to negative control−/−(no GM-CSF/no treatments), (mean ± S.D., n = 3 independent wells from two monocyte isolations, CD206: ***P < 0.0001; CD80: *P = 0.0397, **P = 0.0267; CD36: *P = 0.0187, **P = 0.0143, compared to control +/− =GM-CSF control/no treatments by one-way ANOVA and Tukey post hoc test). c Characterization of primary monocytes derived macrophages in perfused TEBVs with GM-CSF pretreatment and addition of eLDL for 96 h with or without 8 h TNFα treatment; fluorescence images of, monocytes-cell tracker red, CD80 + monocytes-green (scale bar 100 μm). d Quantification of mean fluorescence intensity (MFI) per cell of CD80 + monocytes (green signal) based on the images in panel (c) (mean ± S.D., n = 3 TEBVs, *P = 0.034, **P = 0.00066, ***P < 0.0001 compared to negative control by one-way ANOVA and Tukey post hoc test).

