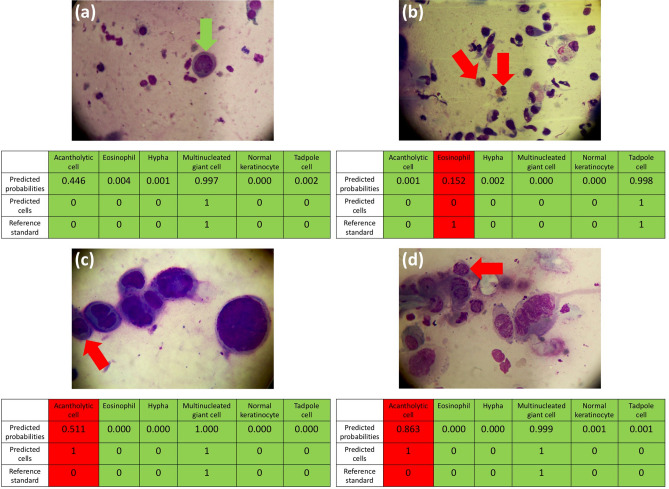
Figure 3.
TzanckNet predictions and the corresponding reference standards for four selected images. For each cell type and image, TzanckNet predicts the probability of that cell type being present in the image. Probabilities are then converted to decisions of absence (0) or presence (1) of that cell, using a discrimination threshold of 0.5. Decisions matching with the reference standards are marked with green, and with red otherwise. The red arrows indicate the cells that are related to the false predictions. The green arrow indicates a multinucleated giant cell.

