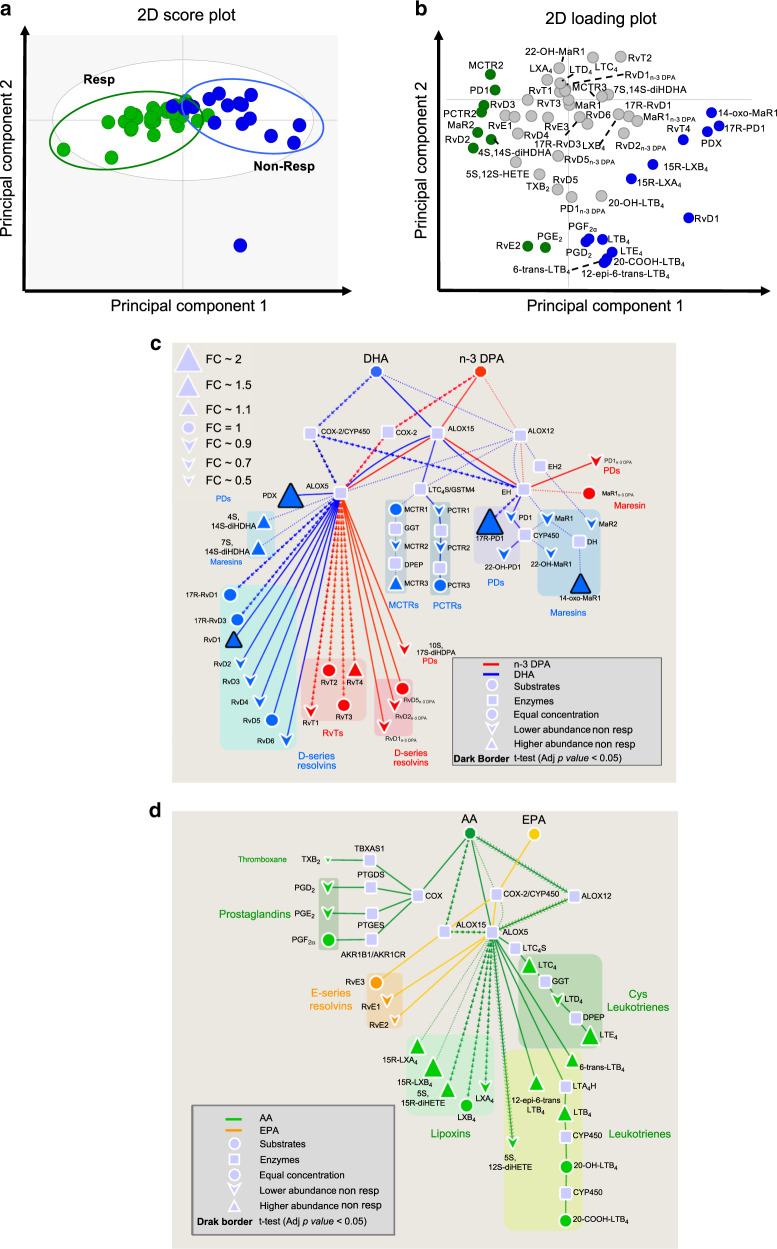
Fig. 4. Decreased SPM levels in DMARD non-responders 6 months after treatment initiation.
Peripheral blood was collected in patients that displayed reduced joint disease (DMARD responders, Resp) and those that did not (DMARD non-responders; Non-Resp) 6 months after treatment initiation. Peripheral blood lipid mediator profiles were established using LC-MS/MS-based lipid mediator profiling. a, b OPLS-DA of lipid mediator profiles from Resp and Non-Resp. a Score plot, b Represents the loading plot with mediators displaying VIP score >1 highlighted in green or blue and correspond with either Resp or Non-Resp, respectively. c, d Pathway analysis for the differential expression of mediators from the c DHA and n-3 DPA and d EPA and AA bioactive metabolomes in Non-Resp when compared to Resp. Statistical differences between the normalised concentrations (expressed as the fold change) of the lipid mediators from the Non-Resp and Resp groups were determined using a two-sided t test followed by multiple comparison correction using Benjamini–Hochberg procedure. Up- or downregulated mediators are denoted with using upward and downward facing triangles, respectively, and on changes of the node’s size. Bolded mediators represent statistical differences between the two groups when adjusted p value <0.05. Results are representative of n = 27 for Resp and n = 17 for Non-Resp. Source data are provided as a Source data file.

