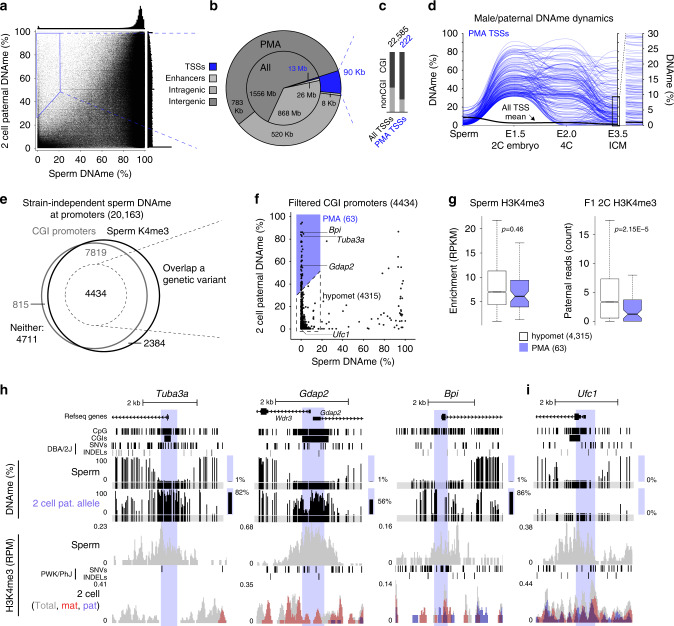
Fig. 1. Paternal DNA methylation acquisition (PMA) at CpG-rich promoters by the 2C stage.
a Male/paternal DNAme levels in sperm and 2C F1 hybrid embryos. Each data point represents the mean DNAme level over a 600 bp genomic bin overlapping at least two informative CpGs (covered by 5× reads and separated by >1 sequencing read length) in both datasets (n = 3,611,409). Bins showing PMA (≥30% gain in paternal DNAme) are highlighted. Histograms depicting the distribution of DNAme levels in both datasets are included. b Pie chart illustrating the genomic lengths of TSSs, enhancers, gene bodies (intragenic) and intergenic loci: genome-wide (inner circle) and over regions that show PMA (outer circle). c The proportion of CpG island promoters in annotated autosomal TSSs versus those that undergo PMA, with the number of TSSs shown above. d Parallel-coordinate plot illustrating male/paternal DNAme dynamics over TSSs that undergo PMA in sperm and the preimplantation embryo. Each line represents a TSS that undergoes PMA and overlaps at least two informative CpGs in each dataset (n = 175). The mean DNAme level of autosomal TSSs is indicated by a black line. DNAme levels for E3.5 (ICM) are shown on two scales to illustrate the retention of DNAme at this stage. e Venn diagram including all annotated autosomal promoters with sperm DNAme levels consistent between C57BL/6J and DBA/2J strains. The proportion of such promoters with high/intermediate CpG density (CGIs) and enriched for H3K4me3 in sperm is depicted. The subset overlapping a genetic variant and at least two informative CpGs in sperm and 2C WGBS datasets are indicated. f CGI promoters showing PMA (≥30% gain in paternal DNAme) from sperm to the 2C stage (n = 63) versus persistent hypomethylation (hypomet, n = 4315) are shown. g Distribution of H3K4me3 levels at PMA (n = 63) or hypomet (n = 4315) CGI promoters is shown for sperm (left) and on the paternal allele in 2C embryos (right). Boxplots show the median (line inside the box), where 50% of the data are distributed (the box), and whiskers denote the values lying within 1.5 times the interquartile range. Two-sided t-tests assuming unequal variances were performed. h, i UCSC genome browser screenshots of the promoter regions of Tuba3a, Gdap2, Bpi and Ufc1. TSS regions (+/−300 bp) are highlighted in blue and the location of informative CpGs (5× coverage) for each WGBS dataset are highlighted in grey below each WGBS dataset. Mean DNAme levels over-highlighted regions are indicated to the right of each DNAme genomic track. The genomic locations for NCBI Refseq genes, all CpG dinucleotides, CGIs and genetic variants used in our allele-specific analyses (SNVs and INDELs) are also included. 2C H3K4me3 data are represented as a composite track containing total (allele-agnostic, grey), maternal (red) and paternal (blue) genomic tracks. Source data are provided as Source Data and Supplementary Data 3 files.

