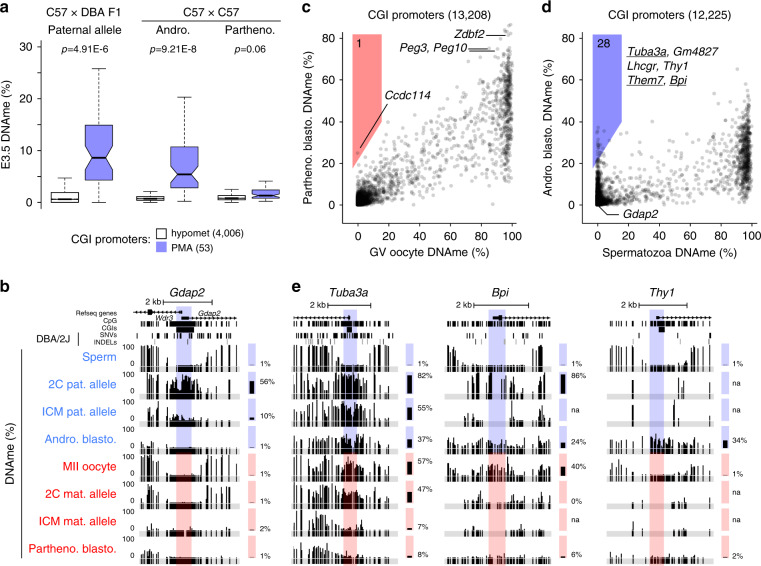
Fig. 2. Paternal DNAme levels at many PMA sites are maintained in normal and androgenetic blastocysts.
a Distribution of hypomet (n = 4006) and PMA (n = 53) CGI promoter DNAme levels in embryonic day 3.5 C57 × DBA F1 ICM, androgenetic blastocysts and parthenogenetic blastocysts. Boxplots elements are as defined in Fig. 1g. Outliers not shown. Two-sided t-tests assuming unequal variances were performed. b Screenshot of the Gdap2/Wdr3 CGI promoter, presented as in Fig. 1. c, d 2D scatterplots depicting DNAme levels over individual CGI promoters in E3.5 c parthenogenetic blastocysts versus GV oocyte (data excludes polar bodies; n = 13,208) and d androgenetic blastocysts versus sperm (n = 12,225). Promoters that gain ≥20% DNAme are highlighted and genes previously identified using our allele-specific DNAme analysis pipeline are underlined. e Screenshots of the Tuba3a, Bpi and Thy1 CGI promoters. Source data are provided as a Source Data file.

