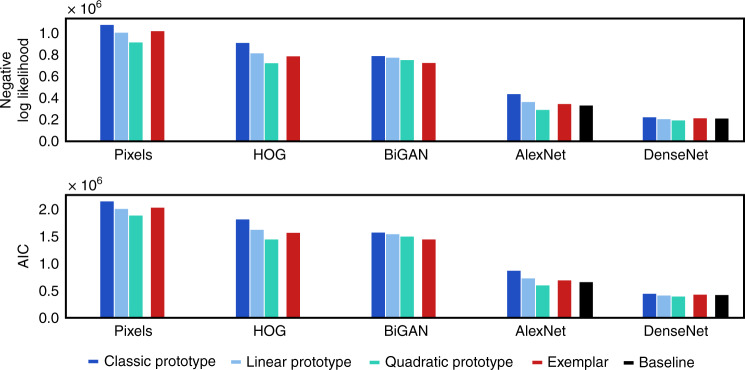
Fig. 5. Categorization model results.
Negative log-likelihood and AIC results for all categorization models using all five stimulus representations (lower scores mean better performance). Within each representation, models are colored and clustered by class (prototype, exemplar). Baseline model performances are shown using a black bar for relevant feature spaces (AlexNet and DenseNet). Source data are provided as a Source Data file.

