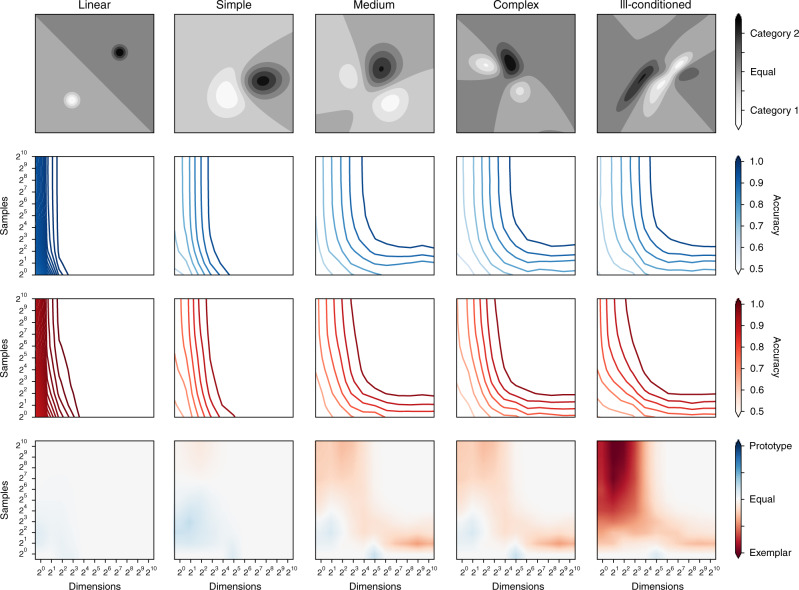
Fig. 7. Performance of categorization models depends on dimensionality of stimuli.
Categories of increasing complexity were created (columns, left to right), and prototype and exemplar accuracy compared on stimuli sampled from them. Top row: representative category structures. Middle rows: prototype (blue) and exemplar (red) model accuracy, as the number of dimensions (horizontal axes) and training samples (vertical axes) varies. Bottom row: comparison of middle rows (prototype accuracy—exemplar). Each point represents the averaged results from 300 different distributions, with bilinear smoothing between points. In different regimes, the relative performance of prototype and exemplar models varies significantly, in particular between the regimes covered in laboratory studies (top left) and those necessary to cover more naturalistic categorization studies (top right). Source data are provided as a Source Data file.

