Figure 1.
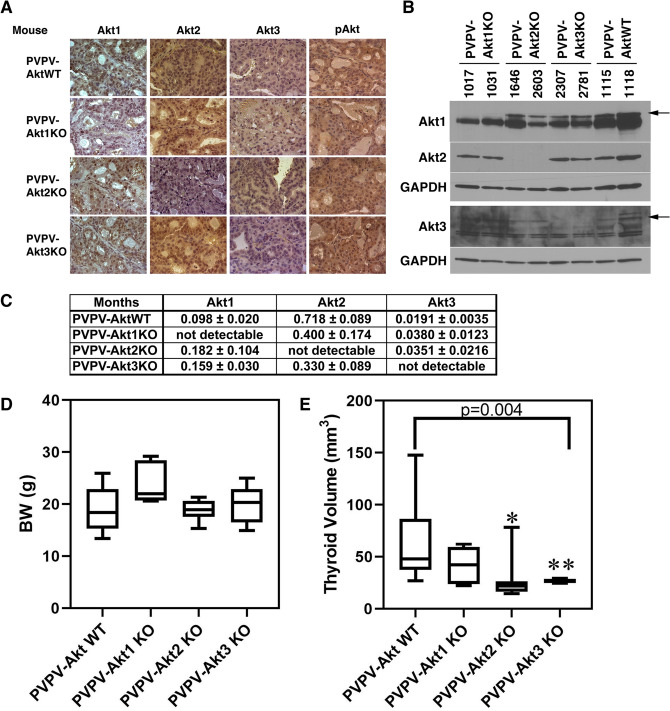
Akt-isoform expression in the thyroid, body weight (BW), and thyroid size in PVPV-AktWT and PVPV-Akt isoform-specific KO mice. Akt isoform protein expression levels were examined by IHC (A), immunoblot (B), PVPV-AktWT mouse thyroid tissue expressed all Akt isoforms. Akt isoform specific KO mouse thyroids had loss of the expected protein. Separate blots were performed as delineated on the image by the white spaces. Akt 1, 2 and the upper GAPDH are from the same blot; Akt 3 and lower GAPDH are from the same blot. Antibody information is in Supplemental Table 2 and full WB images are Supplemental Fig. 4. (C) RNA levels of each Akt isoform from mouse thyroids at 12 months of age were examined by quantitative RT-PCR (n = 4–8). Results are as units calculated by ∆ Ct method normalized to 18S rRNA expressed as mean normalized values. Body Weight (D) and thyroid size (E) at ~ 12 months were compared among the 4 groups (n = 12 month group in Fig. 2E). BW was not different between the groups. Thyroid sizes were significantly smaller in PVPV-Akt isoform-specific mice vs. PVPV-AktWT (p = 0.004). For individual groups, *p < 0.002, **p < 0.004; PVPV-Akt1 mice had a p = 0.09. Graph images were created using Graphpad Prism version 8.4.2 (https://graphad.com).

