Figure 6.
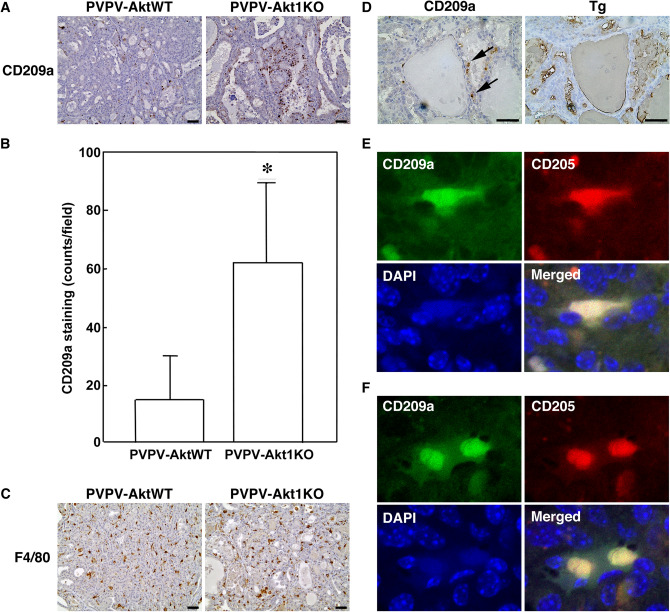
CD209a cells are increased in PVPV-Akt1KO mouse thyroid. (A) IHC of CD209a confirmed the presence and increase of expression in PVPV-Akt1KO mouse thyroid by IHC, representative image is shown. (B) Quantitation of four pairs of age-matched PVPV-AktWT and PVPV-Akt1KO mice demonstrate an increase of CD209a cells in the Akt1KO mice (62 ± 27 vs 15 ± 15 cells/20 × field; p < 0.05). (C) The macrophage marker F4/80, was highly expressed in both the PVPV-AktWT and Akt1KO mouse thyroids and the expression pattern was distinct from CD209a. (D) Tg staining was distinct form CD209a staining. (E, F) Confocal microscope images were taken by 40× objective and digitally enlarged by 5× and show a subset of CD209a cells that co-express CD205 (representative images shown). Primary and secondary antibody negative controls are in Supplemental Fig. 4. Graph images were created using Graphpad Prism version 8.4.2 (https://graphad.com).

