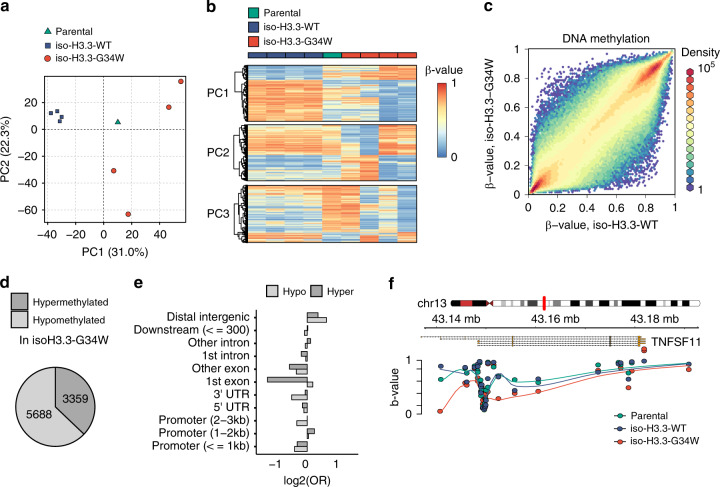
Fig. 4. Recapitulation of DNA methylation alterations in an isogenic system.
a Principal component (PC) analysis of HumanMethylationEPIC profiles of parental (green triangle), iso-H3.3-WT (blue rectangles) and iso-H3.3-G34W (red circle) HeLa cells. Each data point represents an independent clone. b Methylation levels of top 2000 probes associated with each of the first three principal components in one parental (green), four iso-H3.3-WT (blue) and four iso-H3.3-G34W cells (red). c Scatter plot of average individual CpG probe methylation of four iso-H3.3-WT (x-axis) vs. four iso-H3.3-G34W (y-axis) clones. Color dots indicate incremental delta means of methylation, with orange representing >0.5 delta-mean. d Fractions of HumanMethylationEPIC probes differentially methylated between iso-H3.3-G34W and iso-H3.3-WT HeLa cells, by direction of DNA methylation change (light gray–hypomethylation, dark gray–hypermethylation). e Enrichment (positive values) or depletion (negative values) of major gene model features among differentially methylated probes. OR, odds ratio. f Genome browser snapshot displaying DNA methylation levels of CpGs in the vicinity of the TNFSF11 locus in parental (green), iso-H3.3-WT (blue) and iso-H3.3-G34W cells (red). Points represent methylation values of individual CpGs and the lines depict LOESS curves with degree 1 and span 0.5.

