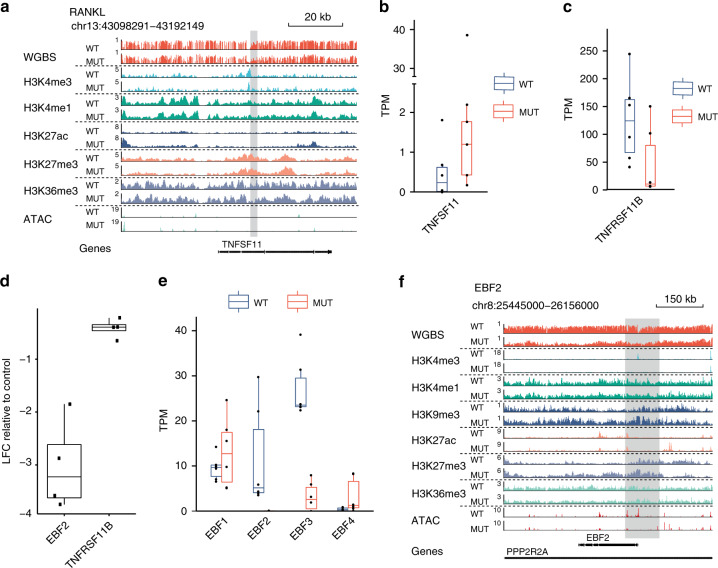
Fig. 5. The epigenetic determinants of the osteolytic phenotype in GCTB.
a Genome browser view of the gene TNFSF11 encoding for RANKL. Each lane (dash-separated) represents normalized averaged signals of DNA methylation (WGBS), the level of H3K4me3, H3K4me, H3K9me3, H3K27ac, H3K27me3, H3K36me3, and chromatin accessibility (ATAC) in several replicates of H3.3 WT (lane-wise top) or H3.3 MUT (lane-wise bottom) cells. b, c Expression levels of RANKL (TNFSF11) and OPG (TNFRSF11B) in H3.3 WT (blue) H3.3 MUT (red) cells as analyzed by RNA-seq. TPM, transcripts per million. Differences were borderline significant for both genes with p = 0.092 (TNFSF11) and p = 0.062 (TNFRSF11B), Wilcoxon rank sum test with n = 6 independent patient cell lines in each group. d Expression analysis of EBF2 and OPG (TNFRSF11B) by qRT-PCR 48 h after siRNA-mediated knockdown of EBF2 in H3.3 WT cells (UPI-13). Log fold change (LFC) relative to expression in cells transfected with control siRNAs. n = 4 independent experiments are shown. Results showed significance in a one-sample t-test with p-values 0.006 and 0.018. e Expression levels of all members of the EBF family in H3.3 WT (blue) H3.3 MUT (red) cells as analyzed by RNA-seq. TPM, transcripts per million. Differences were significant for EBF2 (p = 4.8 × 10⁻³) and EBF3 (p = 2.1 × 10⁻³), Wilcoxon rank sum test with n = 6 independent patient cell lines in each group. f Genomic browser view of the EBF2 locus. Legend as in a. All analyzed stromal cells with their UPIs are listed in Supplementary Data 1. In all boxplots bar represents the mean, box the IQR, upper and lower whiskers extend from the smallest to the largest value within 1.5 IQR from the lower and upper edges of the box, respectively.

