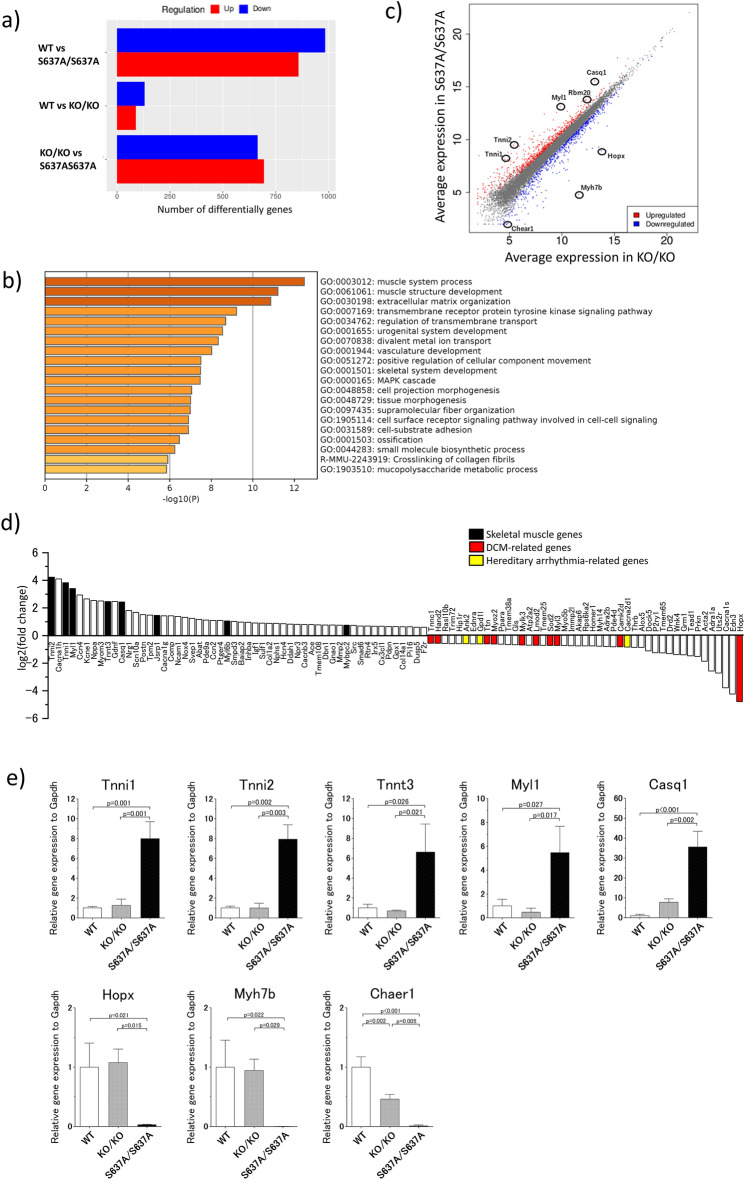
Figure 6.
Gene expression profile of Rbm20S637A/S637A mice is distinct from those of WT and Rbm20KO/KO mice. Poly(A)+ RNAs extracted from ventricles of WT and Rbm20 mutant mice (n = 3 each) were subjected to RNA-seq analysis. (a) Numbers of DEGs between indicated genotypes of mice. A cut-off of a FDR < 0.05 and gene expression fold change > 1.5 or < 0.667 were applied. (b) Enrichment analysis of Rbm20S637A/S637A vs Rbm20KO/KO. Bar colors represent p values. (c) A scatter plot for Rbm20S637A/S637A vs Rbm20KO/KO. Each dot represents each gene. Skeletal muscle genes and DCM-related genes top-ranked among the DEGs are indicated. (d) Relative expression levels of DEGs between Rbm20S637A/S637A and Rbm20KO/KO mice with a GO term ‘muscle system process’ (GO:0003012). Skeletal muscle genes, DCM-related genes, and causative genes of hereditary arrhythmia are colored as indicated. (e) qPCR analysis of DEGs top-ranked in the RNA-seq analysis. n = 3 each. p values with statistical significance after Tukey's HSD test are indicated. Error bars, SEM.

