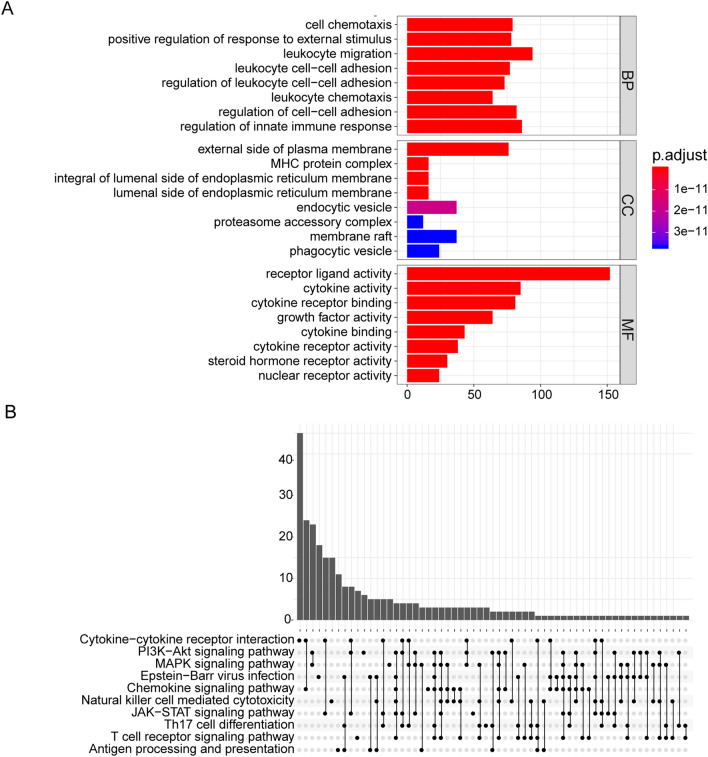
Figure 1.
GO and KEGG analysis of DEIRGs. (A) GO enrichment analysis of DEIRGs. The color of the bar indicates p.adjust: the redder the color, the smaller the p.adjust value; the bluer the color, the larger the p.adjust value. The horizontal axis represents the number of DEIRGs under the GO term. (B) KEGG pathways enrichment analysis of DEIRGs. Significant gene (p.adjust < 0.05) enrichment to the 10 most important paths. p.adjust: adjusted P-value; BP: biological process; CC: cellular component; MF: molecular function.

