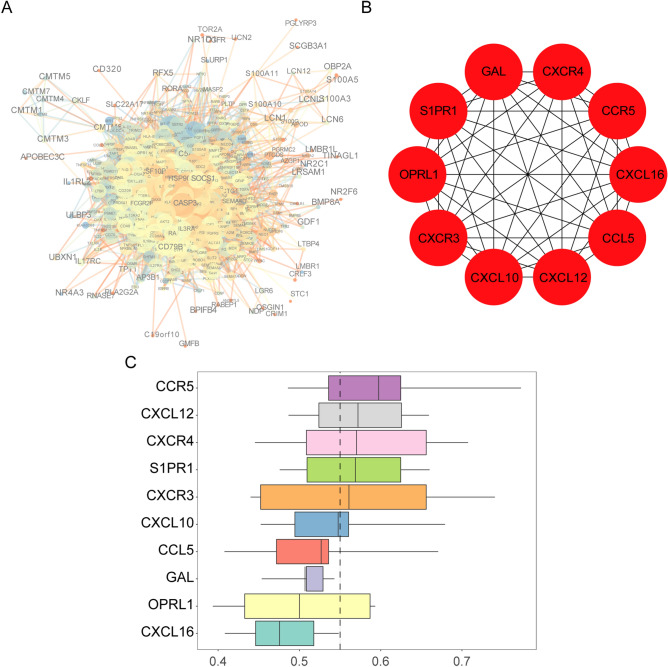
Figure 2.
Protein–protein interaction (PPI), hub IRGs, and functional similarity analysis of DEIRGs. (A) PPI network. The size of a node represents the clustering coefficient, the color indicates the degree, the width of the line indicates the score; the color of the line represents co-expression. (B) Hub IRGs. The hub IRGs were the top 10 DEIRGs scored by the maximum correlation coefficient. (C) Functional similarities of 10 hub IRGs. The boxes indicate the middle 50% of the similarities; the upper and lower boundaries represent the 75th and 25th percentiles. The two ends of the line represent the maximum and minimum values. The dashed line represents the cut-off value of similarity.

