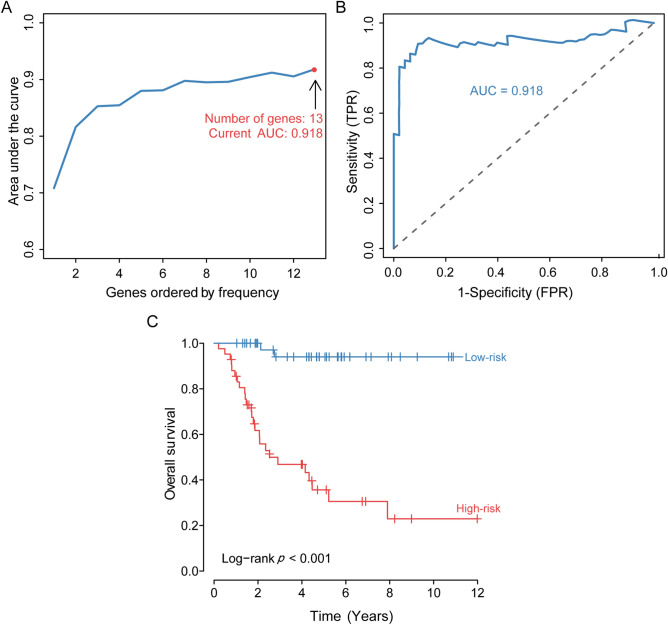
Figure 3.
Development and assessment of the prognostic signature. (A) Construction of the prognosis-associated IRGs signature. The horizontal axis represents the gene frequency and the vertical axis represents the AUC. (B) Time-dependent ROC curve for prognosis-associated DEIRGs signature. The horizontal axis indicates the FDR, and the vertical axis indicates the TPR. (C) Kaplan–Meier survival curves of overall survival from the high-risk and low-risk groups. The horizontal axis represents survival time (y), and the vertical axis represents the survival rate (%). ROC: relative operating characteristic curve; AUC: area under the curve. FDR: false positive rate; TPR: true positive rate.

