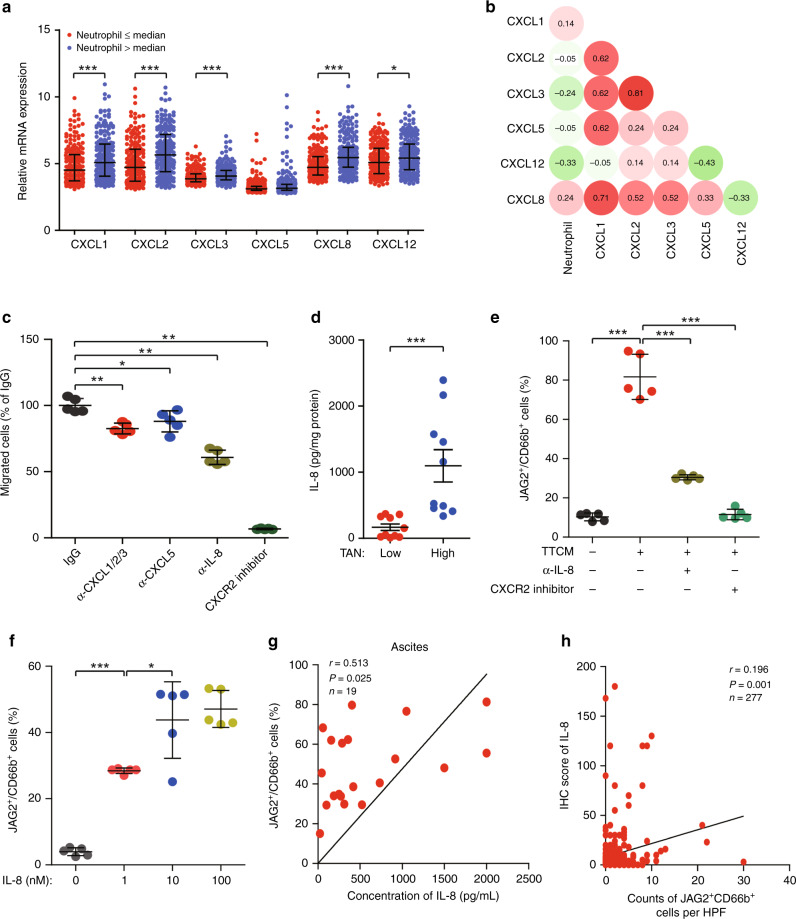
Fig. 5. IL-8 contributes to the recruitment of TANs and induction of JAG2 expression.
a Comparisons of mRNA expression of neutrophil chemoattractants (CXCL1, CXCL2, CXCL3, CXCL5, CXCL8, CXCL12) between EOC with low and high proportions of neutrophils were shown (calculated by CIBERSORT in Cancer Genome Atlas Cohort (TCGA) distinguished by median values) (*P < 0.05, ***P < 0.001). b Heatmap was shown for spearman’s correlation coefficients between neutrophil chemoattractants mRNA expression levels and proportions of neutrophils. c Statistical analyses of proportions of PBNs towards TTCM in the bottom chamber of transwell in the presence of α-CXCL1/2/3, α-CXCL5, and α-IL-8 neutralising antibody, as well as CXCR2 inhibitor were shown(*P < 0.05, **P < 0.01, ***P < 0.001). d Statistical analyses of IL-8 levels in EOC tissues with low or high neutrophils infiltration distinguished by median proportions of TANs were shown (n = 10 per group) (***P < 0.001). e Statistical analyses of JAG2+ cells to total CD66b+ PBNs exposed to TTCM for 12 h in the presence of α-IL-8 neutralising antibody or CXCR2 inhibitor were shown (n = 5) (***P < 0.001). f Statistical analyses of JAG2+ cells to total CD66b+ PBNs exposed to different concentrations of IL-8 for 12 h were shown(n = 5) (*P < 0.05; ***P < 0.001). g Correlation between proportions of JAG2+ cells to total CD66b+ cells and concentrations of IL-8 in ascites from EOC patients were shown (n = 19). h Correlations between counts of JAG2+TANs per high power field (HPF) and IHC score of IL-8 in EOC tissues microarray were shown (n = 277).

