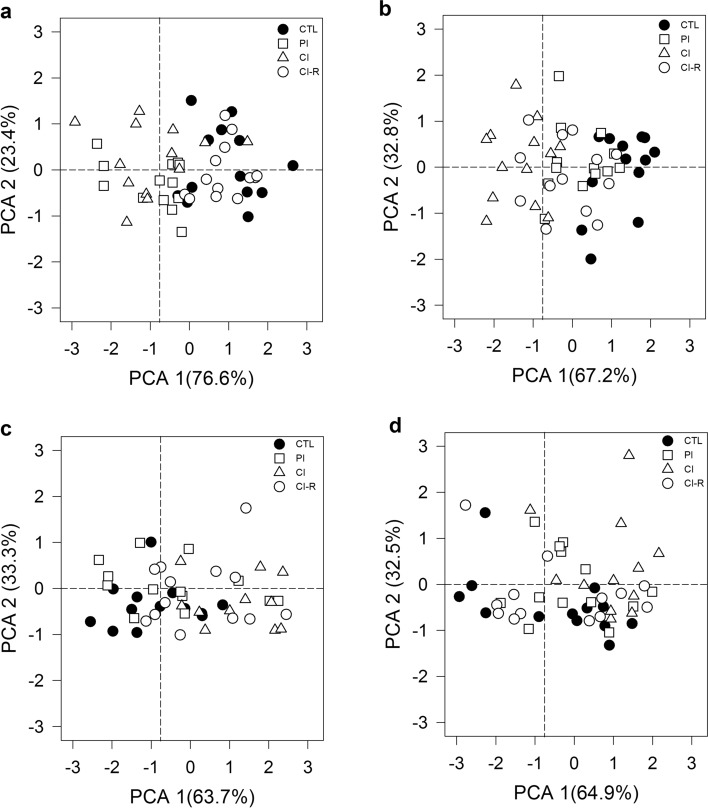
Figure 3.
Principal component analysis (PCA) graph of spatial memory (a,b) and learning performance data (c,d) across the stress treatments for female (n = 13 per group) (a,c) and male (n = 13 per group) (b,d) degus. Each data point represents one degu, and symbols represent each treatment (black circles: Control, CTL group; white squares: Partial Isolation, PI group; white triangles: Chronic Isolation, CI group; white circles: Re-socialization, CI-R group).

