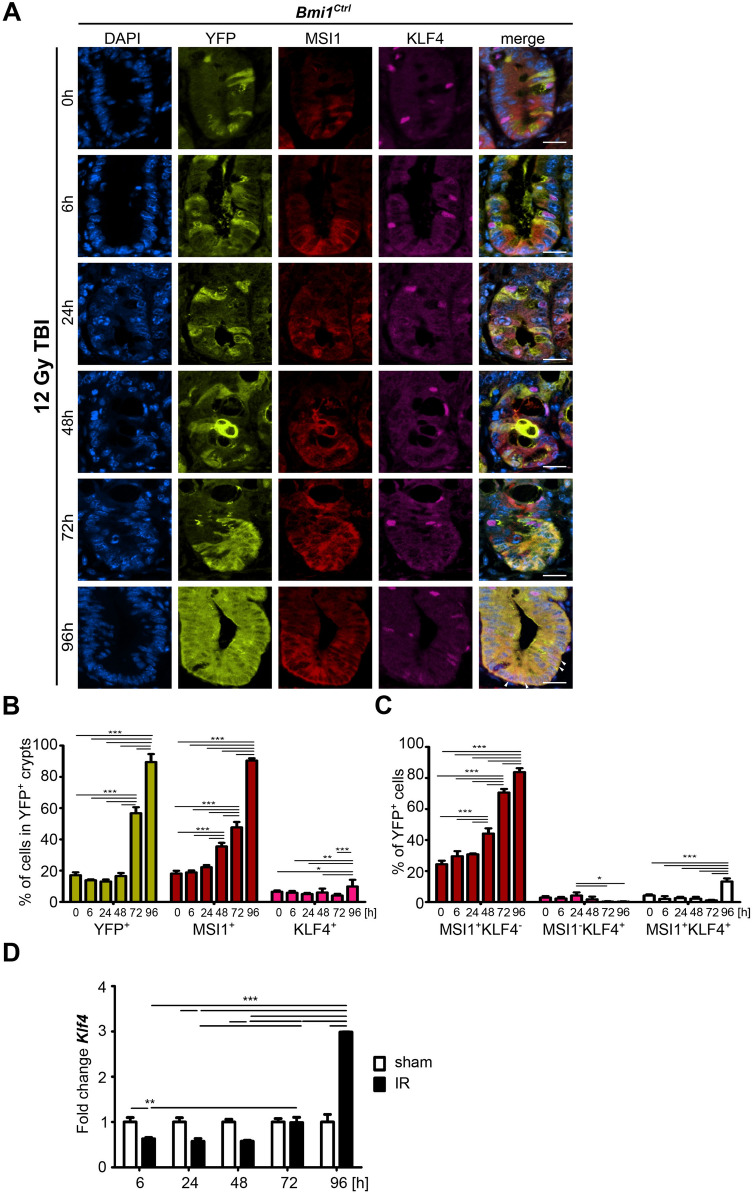
Figure 4.
Time-dependent MSI1 and KLF4 expression patterns in the YFP+ crypts after 12 Gy TBI of the Bmi1Ctrl mice treated according to protocol 1 (Supplementary Fig. 1A). (A) Representative IF images of DAPI, YFP, MSI1, and KLF4 staining in the PSI crypts at 0, 6, 24, 48, 72 and 96 h after irradiation obtained under a fluorescence microscope. The scale bar represents 20 µm. (B) Quantification of the percentage of YFP+, MSI1+ or KLF4+ cells in the YFP+ crypts. (C) Quantification of the percentage of YFP+ cells costained with MSI1, KLF4 or MSI1 and KLF4 together. Data are represented as the mean ± SD, 20 YFP+ crypts were quantified per mouse, and n = 3 mice per group. *p < 0.05, **p < 0.01 and ***p < 0.001 by one-way ANOVA. (D) qRT-PCR analysis of Klf4 expression in the FACS-sorted YFP+ cells isolated from the Bmi1Ctrl mice treated according to protocol 1 (Supplementary Fig. 1A) at 0, 6, 24, 48, 72 and 96 h after irradiation. The sham mice were used as a control. IR, irradiated group (12 Gy TBI). Data are represented as the mean ± SD, n = 3 mice per group. *p < 0.05, **p < 0.01 and ***p < 0.001 by one-way ANOVA.

