Figure 5.
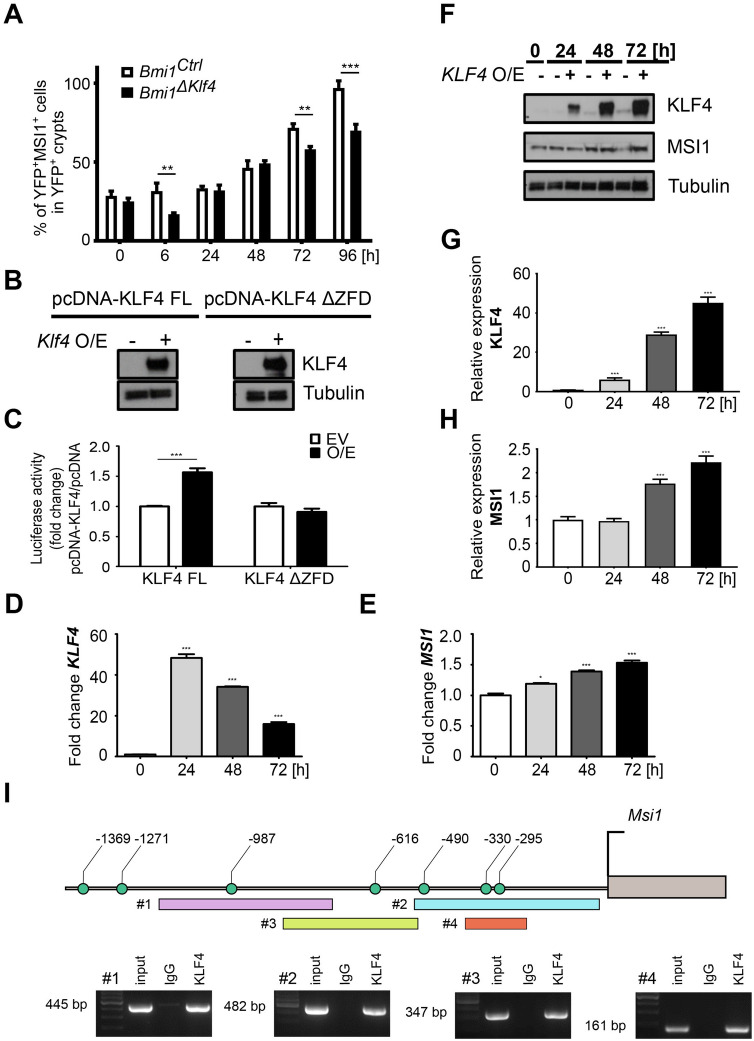
KLF4 positively regulates MSI1 expression by directly binding to its promoter. (A) Comparison of the percentage of YFP+MSI1+ cells in the YFP+ crypts of the Bmi1Ctrl and Bmi1∆Klf4 mice at 0, 6, 24, 48, 72 and 96 h after irradiation based on IF staining analysis. Data are represented as the mean ± SD, 20 YFP+ crypts were quantified per mouse, and n = 3 mice per group. **p < 0.01 and ***p < 0.001 by one-way ANOVA. (B, C) Luciferase assays of the HEK293T cells transfected with pcDNA-Klf4 FL or pcDNA-Klf4 ΔZFD mutant vector and pEZX-PG02 containing the Msi1 promoter sequence. O/E, overexpression. EV, empty vector. (B) Western blot analysis of KLF4. Full-length blots are presented in the “Supplementary file”. (C) Relative luciferase activity. Data are represented as the mean ± SD, n = 3. ***p < 0.001 by Student’s t-test. (D–H) Analysis of the effect of KLF4 FL on MSI1 expression in vitro. O/E, overexpression. EV, empty vector. (D, E) qRT-PCR analysis of KLF4 (D) and MSI1 (E) expression in HEK293T cells. Cells collected at 0 h were used as controls. (F) Western blot analysis of KLF4 and MSI1 in HEK293T cells. Full-length blots are presented in the “Supplementary file”. (G, H) Densitometric analysis of KLF4 (G) and MSI1 (H) in HEK293T cells was performed using ImageJ software. Data are represented as the mean ± SD, n = 3. *p < 0.05, **p < 0.01 and ***p < 0.001 by Student’s t-test. (I) ChIP-PCR analysis of KLF4 binding to the Msi1 promoter. Schematic represents the − 1.4-kb region upstream of the Msi1 TSS showing potential KLF4 binding sites (green circles). ChIP-PCR primer locations are marked with rectangles. DNA electrophoresis gels show PCR products obtained after the reaction with ChIP-purified DNA. Rabbit IgG was used as a negative control. Full-length blots are presented in the “Supplementary file”.

