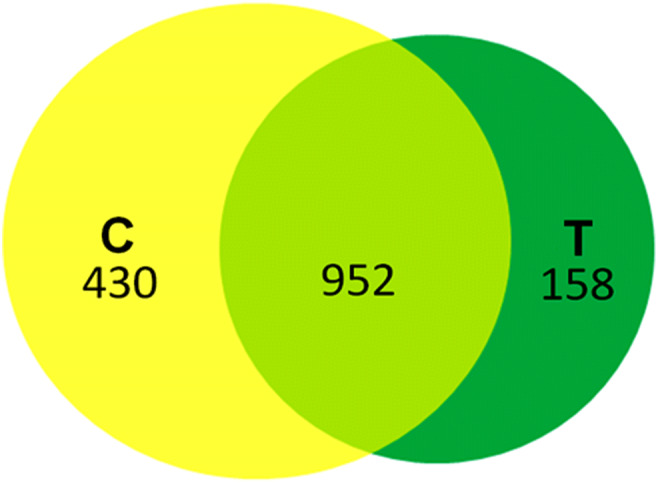
Fig. 1.

Venn diagram showing the protein expression in control and cold stress, respectively. Overlapped (light green) region represents the common proteins expressed in both conditions; yellow region represents the unique proteins in control while dark green represents the proteins expressed only under cold stress
