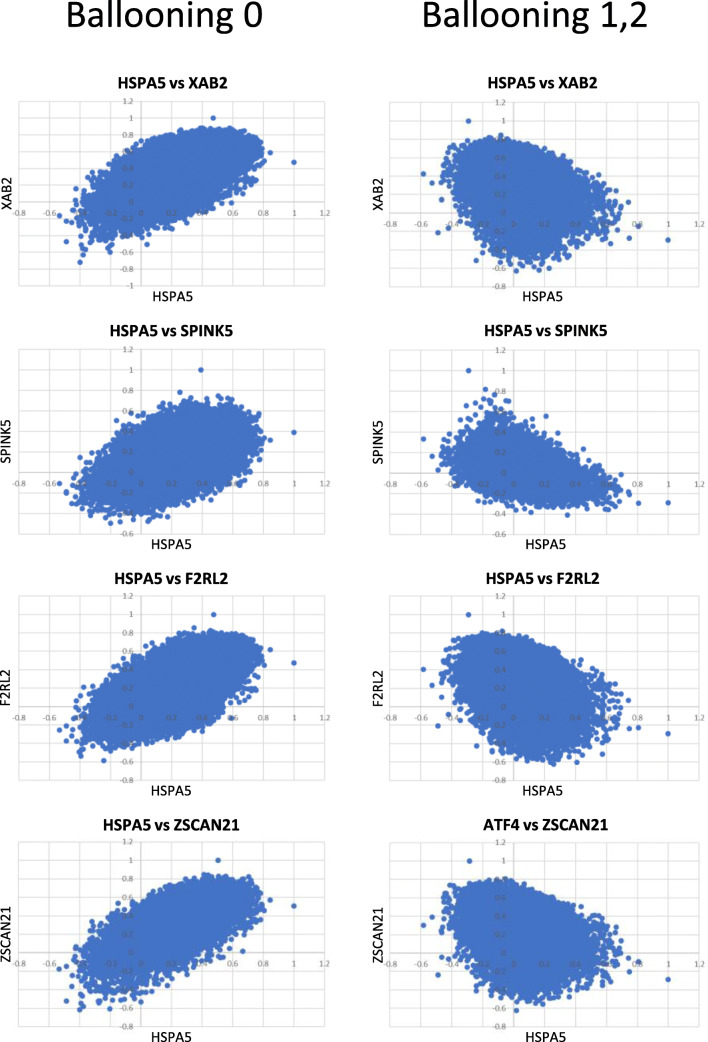
Fig. 4.
Pairwise scatter plots depicting the P value (Pearson’s) in expression levels between HSPA5 and each of XAB2, SPINK5, F2RL2, and ZSCAN21. In these genes, correlation with the HSPA5-associated transcriptome was positive in the specimens without ballooning but reversed to negative in the specimens exhibiting ballooning degeneration of hepatocytes

