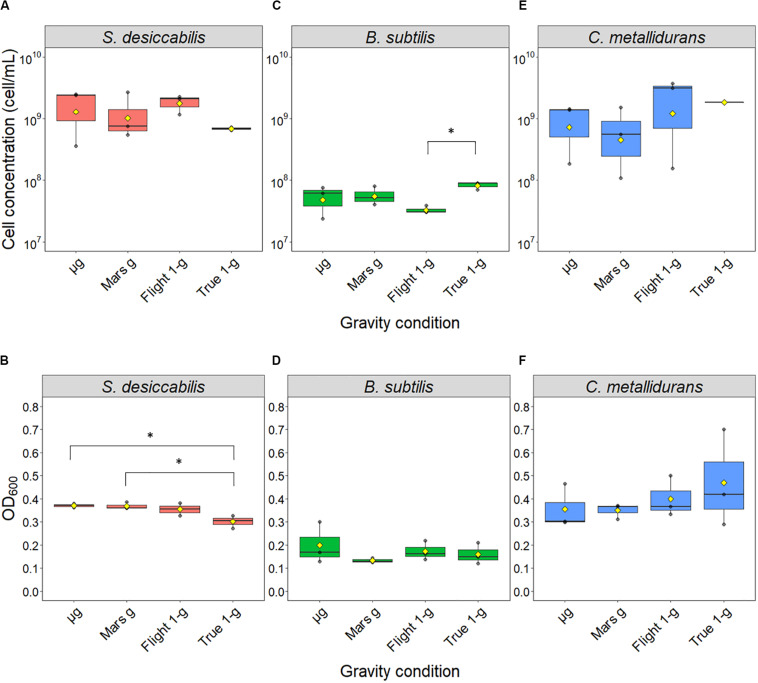
FIGURE 3.
Final cell concentrations obtained after spaceflight. Boxplots of the direct cell counts (upper panel) and optical densities at a wavelength of 600 nm (lower panel) distributions are shown for S. desiccabilis (A, B), B. subtilis (C, D), and C. metallidurans (E, F), respectively. Each dot represents a single measurement (n = 3). Yellow diamonds represent mean values. The horizontal bar indicates the median and boxes represents the 25th to 75th percentile. Asterisks (∗) indicate statistically significant differences (overall α = 0.05, Tukey honestly significant difference correction).

