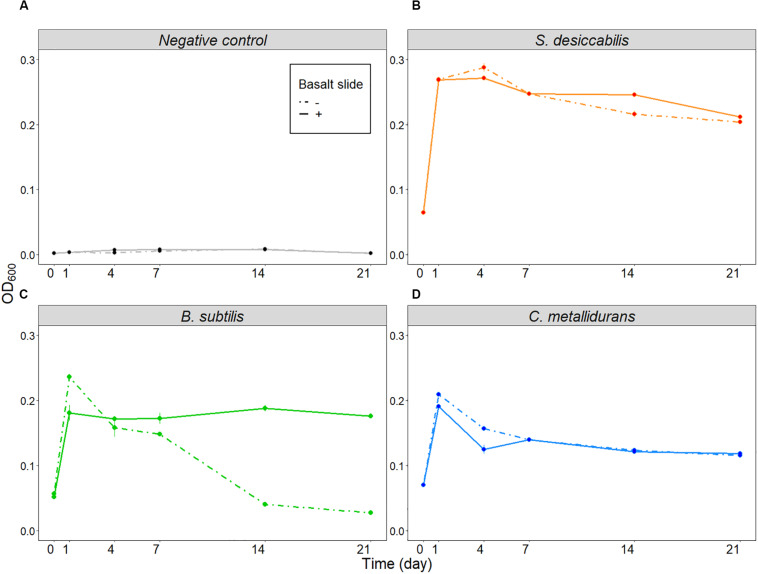
FIGURE 4.
Influence of basalt slide on cell growth (ground experiment). Average optical densities for the three organisms, plus the negative control, over 21 days in the presence or absence of the basalt slide. (A) Shows the results for the negative controls, (B) for S. desiccabilis, (C) for B. subtilis, and (D) for C. metallidurans. Dotted lines represent data from cell cultures grown in the absence of the basalt slide, continuous lines represent growth in the presence of the basalt slide. Mean values from three independent experiments are plotted at each time-point (n = 3). Error bars represent standard errors.

