Figure 3.

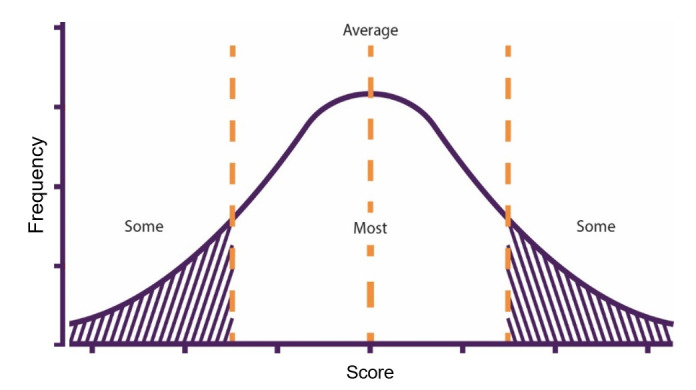
Example distribution of polygenic scores across a population. Thresholds can be set to stratify risk as low (some), average (most) and high (some).

Example distribution of polygenic scores across a population. Thresholds can be set to stratify risk as low (some), average (most) and high (some).