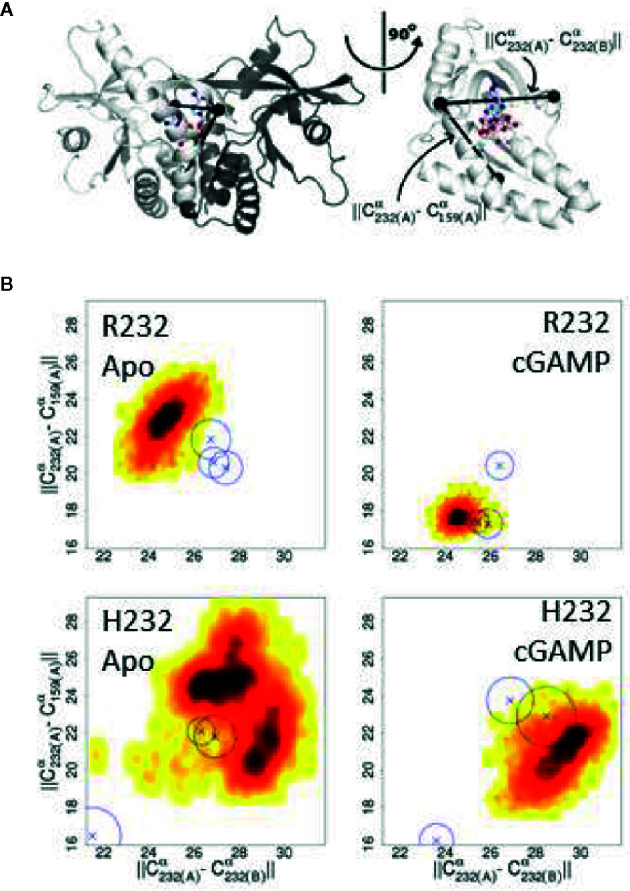
Figure 8.

Changes in the ligand binding loop between R232 and H232 are consistent across conditions. (A) Diagram of the STING structure showing one monomer of the closed conformation in white and the second monomer in gray, with the three Cα atoms used to compute distances marked by black spheres. The bound cGAMP is shown as a ball-and-stick representation. A rotated view, with the second monomer omitted for clarity, more clearly shows the relationship between these Cα positions and the ligand binding site. (B) H232 lead to a consistent expansion of the distances between the ligand binding loops and from the ligand binding loops to the base of the ligand binding site. Probability density plots are shown with the most frequently sampled regions colored black and scaling through red and yellow as data become more sparse. The medians for additional independent replicates are indicated by Xs and a circle indicating the level of variability.
