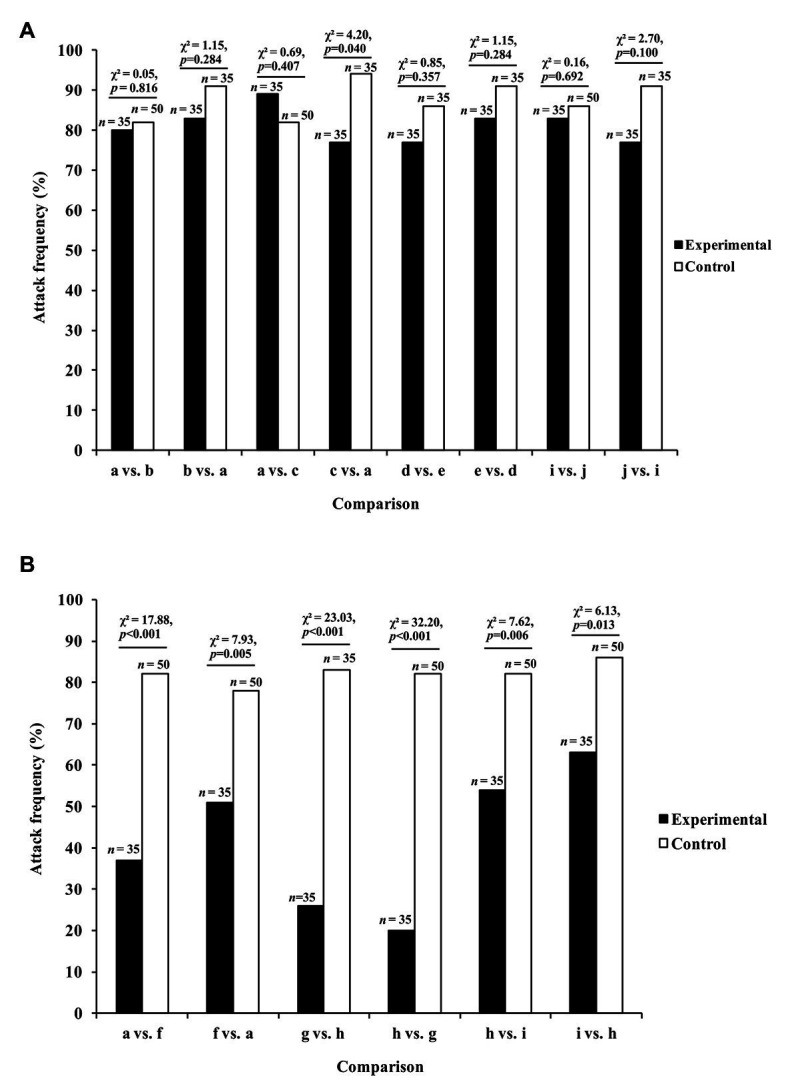
Figure 4.

Results from expectancy violation experiments in which Portia africana was tested with (A) different prey orientations (prey type remained constant) and (B) different prey types (prey orientation remained constant). See Figure 3 for the different prey orientations and types shown during trials. Experimental trials: first prey orientation or prey type replaced by second prey orientation or prey type. Control trials: first prey orientation or prey type did not change during trial. Data analyzed using χ 2 tests of independence. Attack frequency: percentage of test spiders that leapt at the prey. Total number of test spiders (n) shown above bars. Reprinted by permission from Springer (Cross and Jackson, 2014).
