Figure 1.
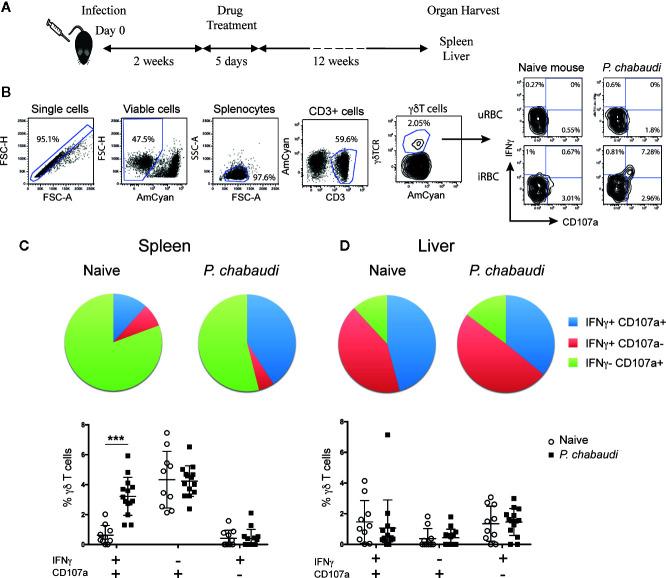
Increased frequency of IFNγ+CD107a+ γδ T cells in previously infected mice. (A) C57BL/6 mice were infected with P. chabaudi and then drug-treated with chloroquine and pyrimethamine 2 weeks later. Twelve weeks following completion of drug-treatment cells were isolated and stimulated with iRBCs or uRBCs and frequencies of IFNγ+ and/or CD107a+ cells were assessed. (B) Representative flow cytometry plots illustrating the gating strategy. Frequencies of IFNγ+ and/or CD107a+ (C) splenocytes, and (D) liver lymphocytes from previously infected mice (P. chabaudi black squares, n=14) and naïve control (white circles, n=10) after stimulation. In the pie chart the data are presented as the frequency of IFNγ+ CD107a+ (blue), IFNγ+ CD107a- (red) and IFNγ- CD107a+ (green) γδ T cells in each group following uRBC background subtraction. The data in the scatter plot are presented as mean ± SD following uRBC background subtraction. The data represent results from two independent experiments. Statistical analysis was performed using Student’s t-tests. ***P < 0.001.

