Figure 3.

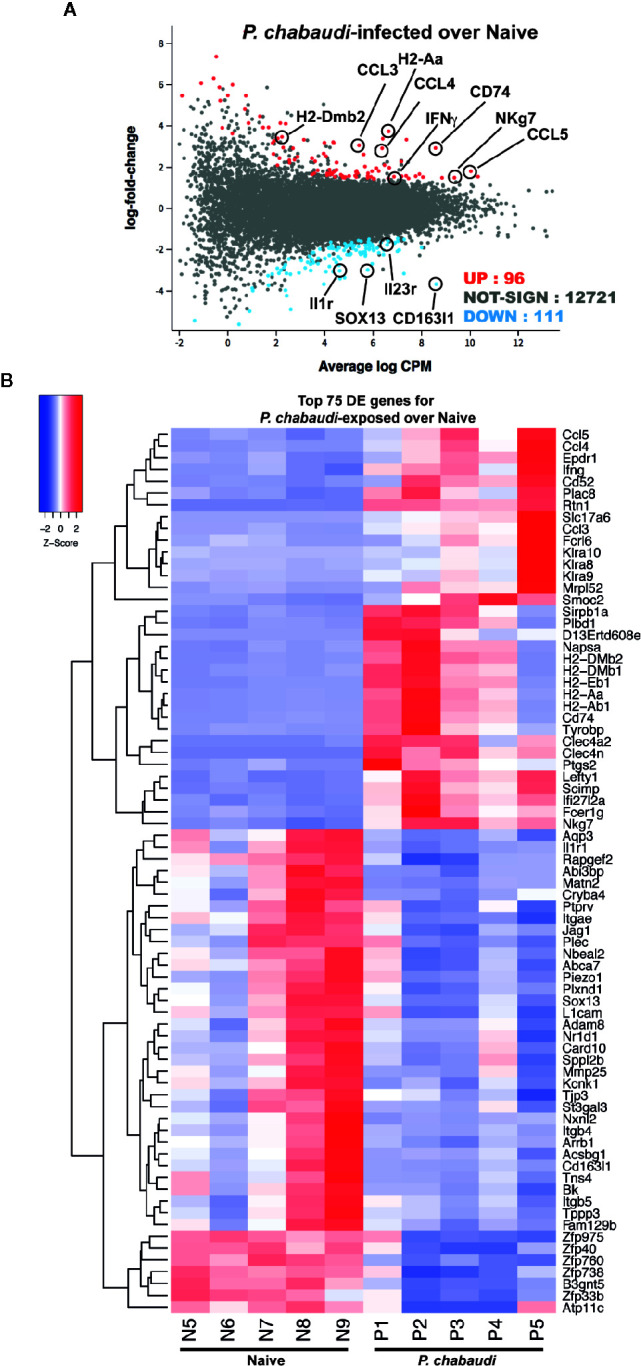
RNA-sequencing of EM γδ T cells from P. chabaudi pre-exposed mice and naïve controls. EM γδ T cells from drug-treated naïve mice (n=5 donors) and P. chabaudi pre-exposed mice (n=5) were FACS sorted followed by RNA extraction and RNA-sequencing. Differential gene expression for P. chabaudi over naïve mice was summarized in (A) mean-difference (MD) plot of log2 expression fold-changes against the average log-expressions for each gene. The differentially expressed (DE) genes relative to a fold change threshold of 1.5 are highlighted, with points colored in red and blue indicating up- and down regulated genes respectively. (B) Heatmap of the expressions of the top 75 DE genes between P. chabaudi and naïve mice. Each vertical column represents genes for each mouse. For a given gene the red and blue coloring indicates increased and decreased expression in P. chabaudi compared to naïve respectively.
