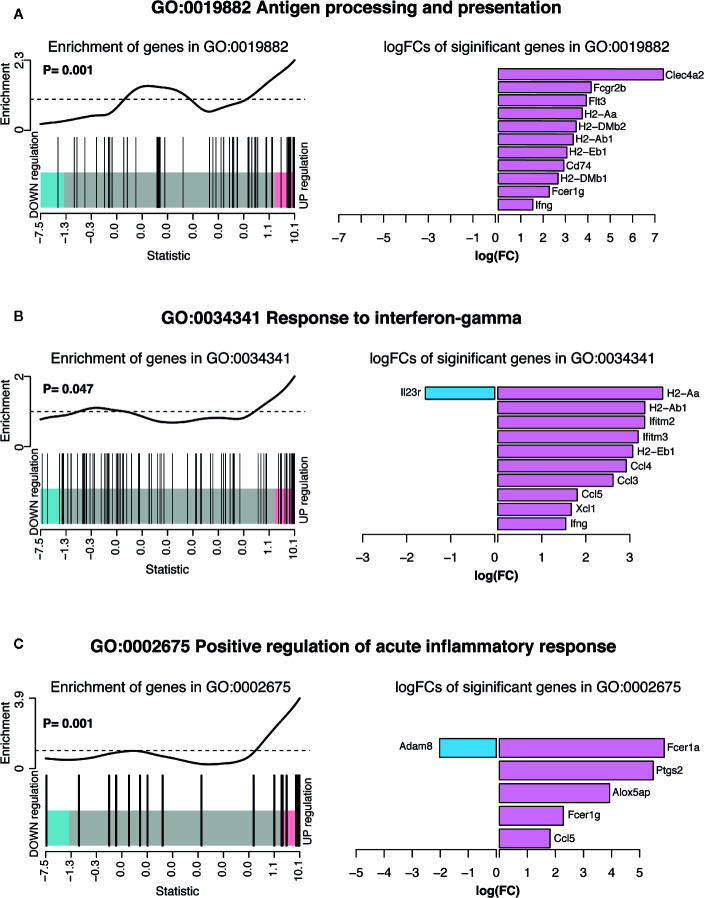
Figure 4.
Summary of significant up or down regulated genes in selected upregulated biological processes. Barcode plots for enrichment of the pathway genes along with p-values relative to gene enrichment tested using ROAST method (left panel) and bar graphs of log fold changes of the significant pathway genes (right panel) for pathways (A) GO:0019882 antigen processing and presentation, (B) GO: 0034341 response to IFNγ and (C) GO:0002675 positive regulation of acute inflammatory response. The barcode plot ranks genes right to left from most up- to most down regulated in P. chabaudi mice, with genes in the pathways marked by vertical bars. The bar graph show log fold changes of significantly upregulated and down regulated genes in the pathway using pink bars and blue bars respectively.

