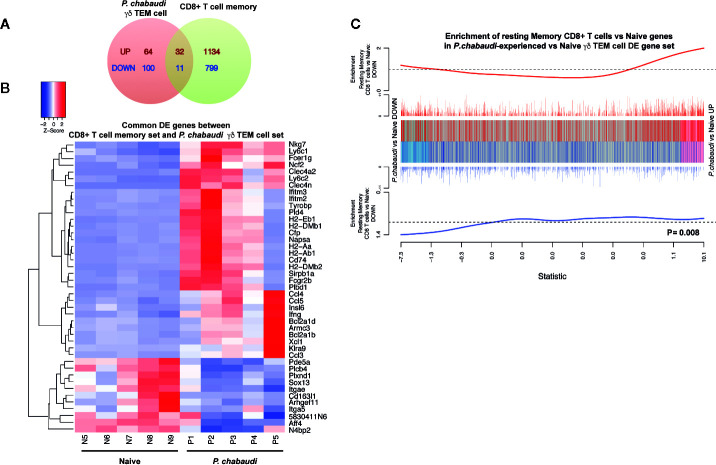
Figure 6.
Differentially expressed genes in P. chabaudi pre-exposed γδ T cells are positively correlated with differentially expressed genes in CD8+ memory T cells. (A) Venn diagram showing the number of overlapping and non-overlapping up-regulated (red) and down regulated (blue) genes. (B) Heatmap of the gene expression relative to P. chabaudi pre-exposed γδ T cells data for the genes commonly significantly regulated (overlapping DE genes) between P. chabaudi pre-exposed γδ T cells data and CD8+ memory T cell data. Each vertical column represents genes for each mouse. For a given gene the red and blue coloring indicates increased and decreased expression in P. chabaudi compared to naïve respectively. (C) Barcodeplot for the enrichment of DE genes in the resting CD8+ memory T cell data in P. chabaudi compared to naïve in the P. chabaudi pre-exposed γδ T cell data, along with the ROAST p-value for the gene set testing.

