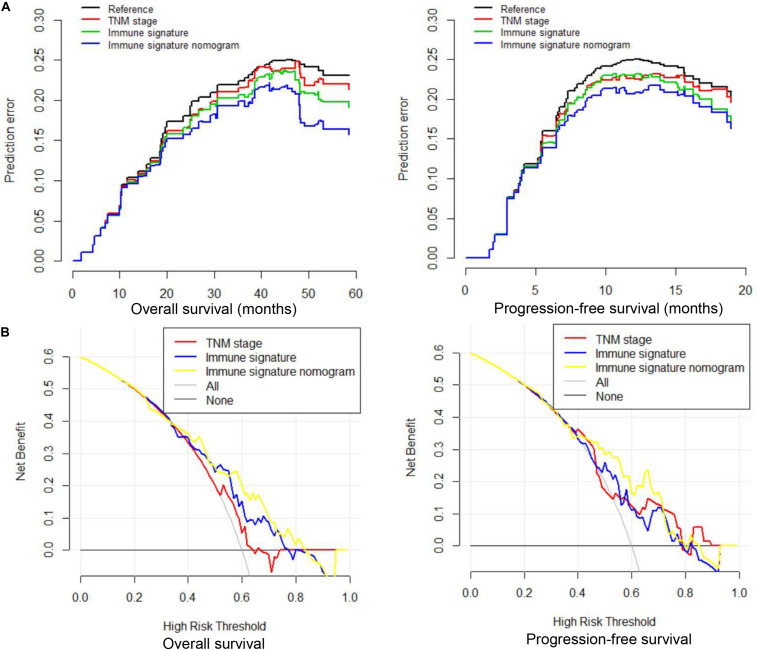
FIGURE 6.
Prediction error curves and decision curve analysis for each model in inoperable locally advanced non-small-cell lung cancer (LA-NSCLC) patients. (A) Prediction error curves for overall survival (OS) and progression-free survival (PFS); lower prediction errors indicate higher model accuracy. (B) Decision curve analysis for OS and PFS. The y-axis measures the net benefit. The net benefit was calculated by summing the benefits (true-positive results) and subtracting the harms (false-positive results), weighting the latter by a factor related to the relative harm of an undetected cancer compared with the harm of unnecessary treatment.

