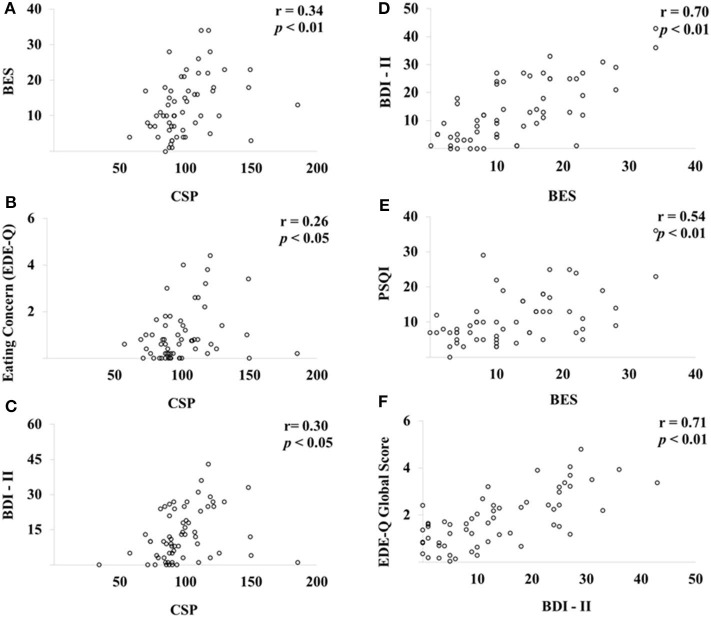
Figure 3.
Pearson's correlation analysis among CSP, eating behavior, and inhibitory control through the Go/No-Go paradigm. Scatter plots of CSP, eating behavior, and Go/No-Go paradigm (n = 60). BES, Binge Eating Scale; CSP, cortical silent period; BDI-II, Beck Depression Inventory; PSQI, Pittsburgh Sleep Quality Index; EDE-Q, Eating Disorder Examination Questionnaire. The CSP was positively correlated with BES (A), Eating Concern (B) and BDI-II (C), while the BES was positively correlated to BDI-II (D) and PSQI (E). BDI-II was positively associated with the EDE-Q global score (F).

