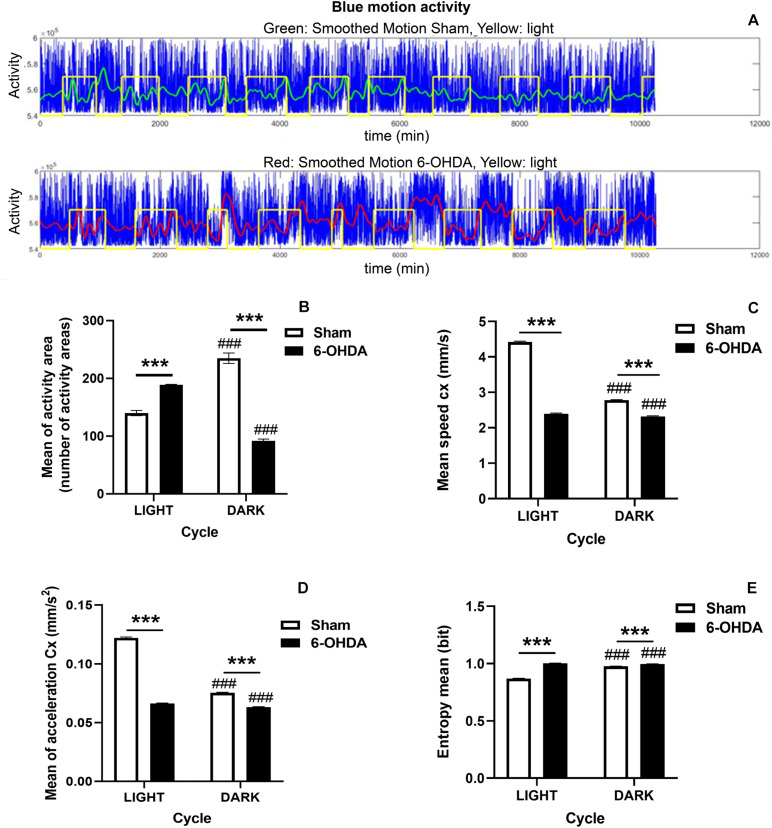
FIGURE 2.
Circadian rhythm disruption in 6-OHDA-induced rats. (A) Diagram illustrating the motion activity signal in 6-OHDA (upper panel) and Sham (bottom panel) groups during the whole manuscript. Afterward, the data are preprocessed and selected in order to obtain for the statistical analysis, appropriated balanced datasets of the light and dark periods for the two groups. Blue: motion activity signal, Green: smoothed signal for control group, Red: smoothed signal for 6-OHDA group, Yellow: light level. Graphs depict significant activity changes (B), the centroid features including the mean of centroid speed (C), the mean of centroid acceleration (D) and the entropy mean (E) between 6-OHDA and Sham groups during the light/dark cycle and within the same group. Data are expressed as mean ± SEM. General analysis was performed by considering 12 h of dark/light periods. Statistical differences appear (p < 0.05) for Mann-Whitney U-test between both groups and within the same group for both light and dark phases (6-OHDA group vs. Sham group, ***p < 0.001; and light cycle vs. dark cycle within the same group, ###p < 0.001).

