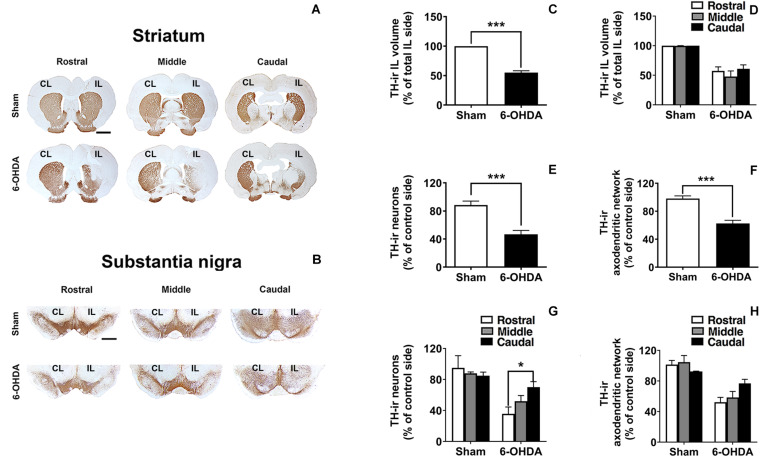
FIGURE 4.
TH-ir loss in the 6-OHDA-induced preclinical model. (A,B) Rostro-caudal distribution of coronal sections corresponding to the CL and IL striatum and SN immunostained with tyrosine hydroxylase (TH) in Sham and 6-OHDA groups. (C,D) Graphs show the effects of 6-OHDA on the loss of the TH-ir volume in the IL striatum comparing to Sham group (***p < 0.001, Unpaired Student’s t-test.) and no significant changes were found along the rostro-caudal axis. (E,F) TH-ir neuronal density and TH-ir ADN density decrease significantly following 6-OHDA administration comparing to Sham group in the SN (***p < 0.001, Unpaired Student’s t-test). (G,H) Topological analysis shows a selective vulnerability in the SN to 6-OHDA decreasing the TH-ir neuronal and the TH-ir ADN density rostro-caudally (*p < 0.05 rostral section vs. caudal section within 6-OHDA group, One-way ANOVA). Data are presented either as the percentage of TH-ir ipsilateral striatal volume respect to the total ipsilateral one (C,D) or as the percentage of TH-ir neurons (E,G) or TH-ir ADN (F,H) remaining in the IL side respect to the CL side. Scale bar: 2 mm (A), 1 mm (B). CL, contralateral; IL, ipsilateral; TH-ir, tyrosine hydroxylase immunoreactivity; 6-OHDA, 6-hydroxydopamine; ADN, axodendritic network; SN, substantia nigra.

