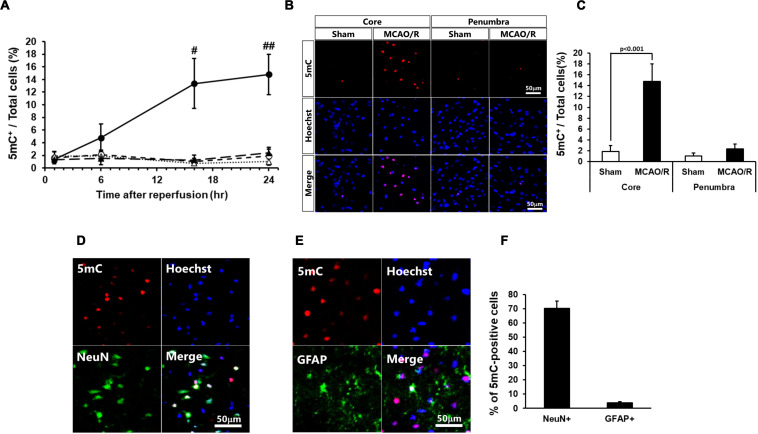
FIGURE 1.
(A) Time course of changes in the number of 5mC-positive cells in the core regions (circle) and penumbra regions (triangle) of the sham-operated (open) and ischemic (closed) rats. In these experiments, 6,404–7,845 cells in the core and 2,058–2,404 cells in the penumbra at 1 h, 5,675–8,572 cells in the core and 2,088–2,699 cells in the penumbra at 6 h, 3,699–7,448 cells in the core and 1,896–2,675 cells in the penumbra at 16 h, and 3,585–7,840 cells in the core and 1,919–2,622 cells in the penumbra at 24 h after surgery were counted per animal. Values represent the means ± SD (n = 4–7 rats per group). #,## Significant difference against the sham-operated group of same time point (#p < 0.01, ##p < 0.001). (B,C) Immunostaining images of 5-methylcytosine (5mC) in the ischemic core and penumbra 24 h after surgery (B) and ratio of 5mC-positive cells to total cells (the number of Hoechst-positive cells; C). (D,E) Double-immunostaining images of 5mC and NeuN (D) and 5mC and GFAP (E) in the core region of 24 h after surgery. (F) Ratio of NeuN- and GFAP-positive cells to 5mC-positive cells in the ischemic core 24 h after surgery. Values represent the means ± SD (n = 6 rats per group). The scale bar represents 50 μm.

