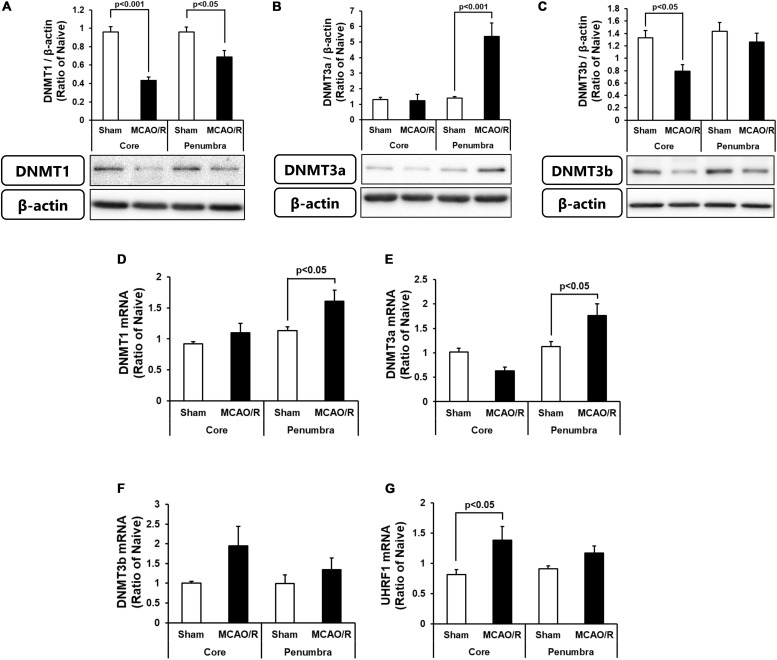
FIGURE 2.
Changes in the protein levels of DNMT1 (A), DNMT3a (B), and DNMT3b (C) in the ischemic core and penumbra 24 h after surgery. These DNMTs and β-actin bands were scanned, and the scanned bands were normalized by the naive control on the same blot. β-Actin was used as a loading control. Results are the means ± SD (n = 5 rats per group). Changes in the mRNA expression levels of DNMT1 (D), DNMT3a (E), DNMT3b (F), and UHRF1 (G) in the ischemic core and penumbra 24 h after surgery. Results are the means ± SD (n = 6–7 rats per group).

