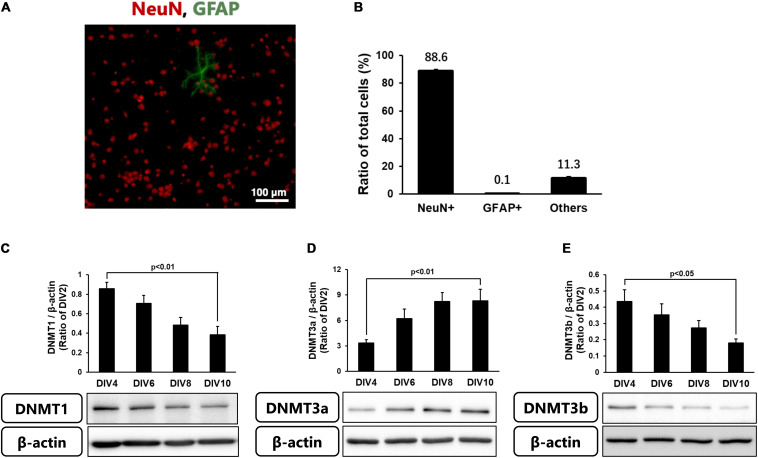
FIGURE 3.
(A) Representative images of double-staining for NeuN (Red) and GFAP (green) in cortical neurons in primary culture at 10 DIV. (B) Ratio of NeuN- and GFAP-positive cells to total cells (Hoechst-positive cells) at 10 DIV. Images of random four areas (each area of 1.3 mm2) of each well were taken, and 1,195–1,320 cells were counted in each well. The scale bar shows 100 μm. Results are the means ± SD (n = 4 independent experiments). (C–E) Changes in the protein levels of DNMT1 (C), DNMT3a (D), and DNMT3b (E) with time in culture. These DNMTs and β-actin bands were scanned, and the scanned bands were normalized by DIV2 cells on the same blot. β-Actin was used as a loading control. Results are the means ± SD (n = 5–13 independent experiments).

