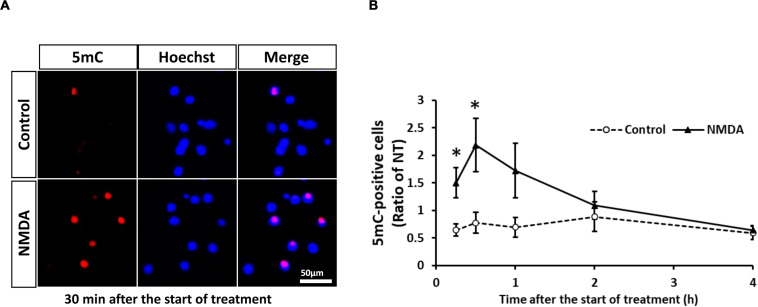
FIGURE 4.
(A) Representative images of 5mC immunostaining 30 min after start of treatment. The scale bar shows 50 μm. (B) Changes in the ratio of 5mC-positive neurons to total cells (Hoechst-positive cells) after start of NMDA (closed triangle) or vehicle (open circle) treatment. Images of random four areas (each area of 1.3 mm2) of each well were taken, and 302–1,250 cells were counted in each well. Results are the means ± SD (n = 7 independent experiments). *Significant difference against the control group of the same time point (p < 0.05). NT, non-treated group.

