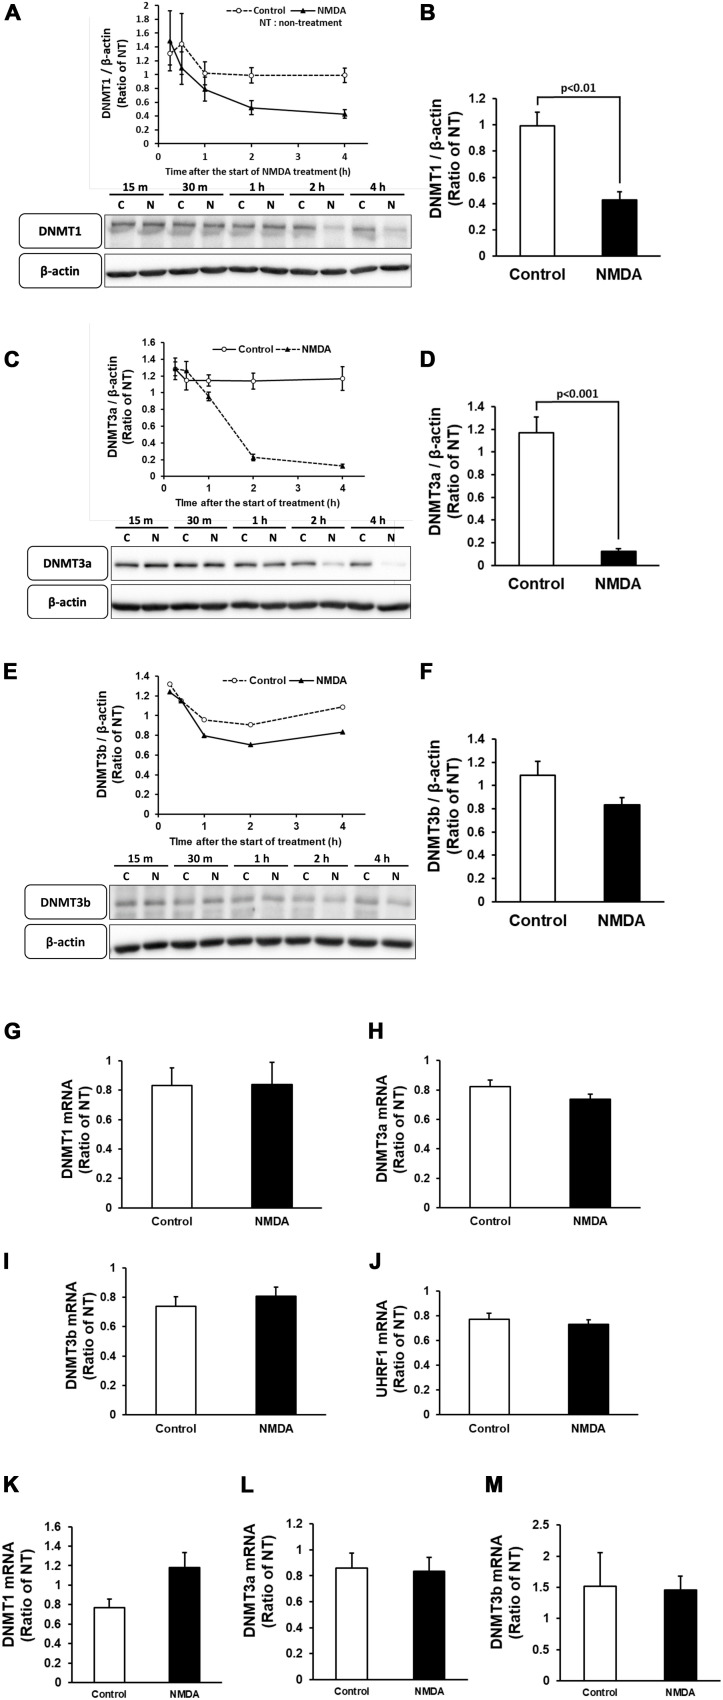
FIGURE 5.
Time course of changes in the protein levels of DNMT1 (A), DNMT3a (C), and DNMT3b (E) in cortical neurons in primary culture after NMDA (closed triangle) or vehicle (open circle) treatment. (B,D,F) Comparison of the protein levels [DNMT1 (B), DNMT3a (D), and DNMT3b (F)] in NMDA-treated group and vehicle-treated control group at 4 h of treatment. These DNMTs and β-actin bands were scanned, and the scanned bands were normalized by the non-treated control on the same blot. β-Actin was used as a loading control. Results are the means ± SD (n = 4–5 independent experiments). (G–J) Changes in the mRNA expression levels of DNMT1 (G), DNMT3a (H), DNMT3b (I), and UHRF1 (J) at 30 min of treatment. Results are the means ± SD (n = 4 independent experiments). (K–M) Changes in the mRNA expression levels of DNMT1 (K), DNMT3a (L), and DNMT3b (M) at 4 h of treatment. Results are the means ± SD (n = 5 independent experiments). NT, non-treated group; C, control group; N, NMDA-treated group. 15 m, 15 min, 30 m, 30 min.

