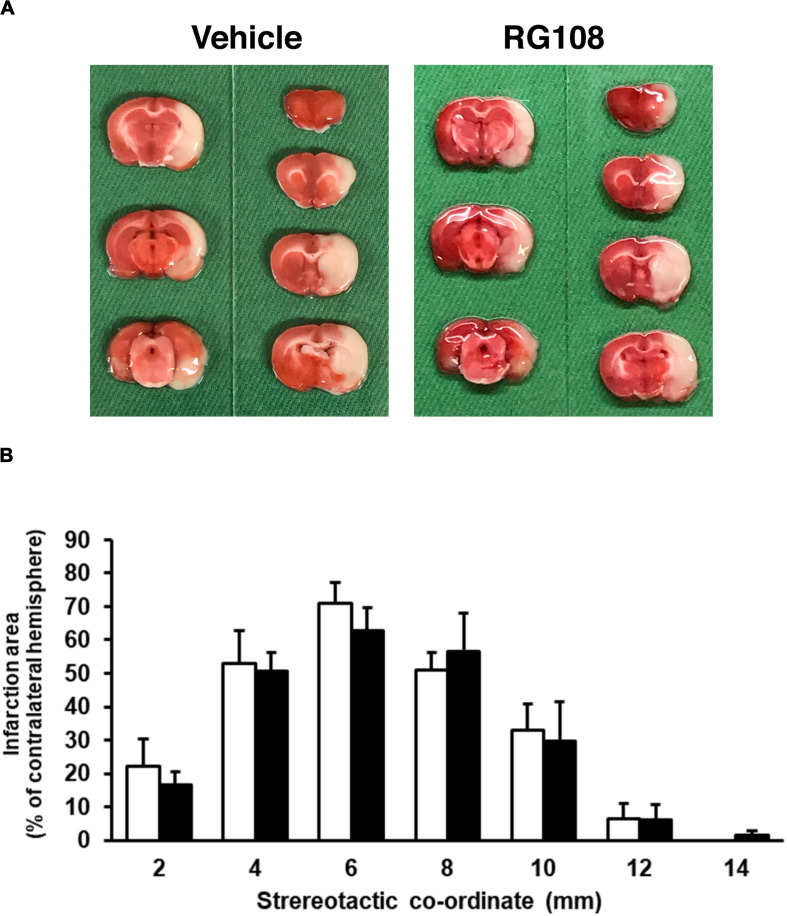
FIGURE 7.
(A) Representative photographs of TTC staining from vehicle- and RG108-treated MCAO/R rats. (B) The infarct area of hemisphere at 2, 4, 6, 8, 10, 12, and 14 mm from the forebrain in the vehicle-treated (white bars) and RG108-treated (black bars) MCAO/R rats 24 h after surgery. The infarct areas are expressed as percentages of contralateral hemisphere. Values represent the mean ± SD (n = 4 each).

