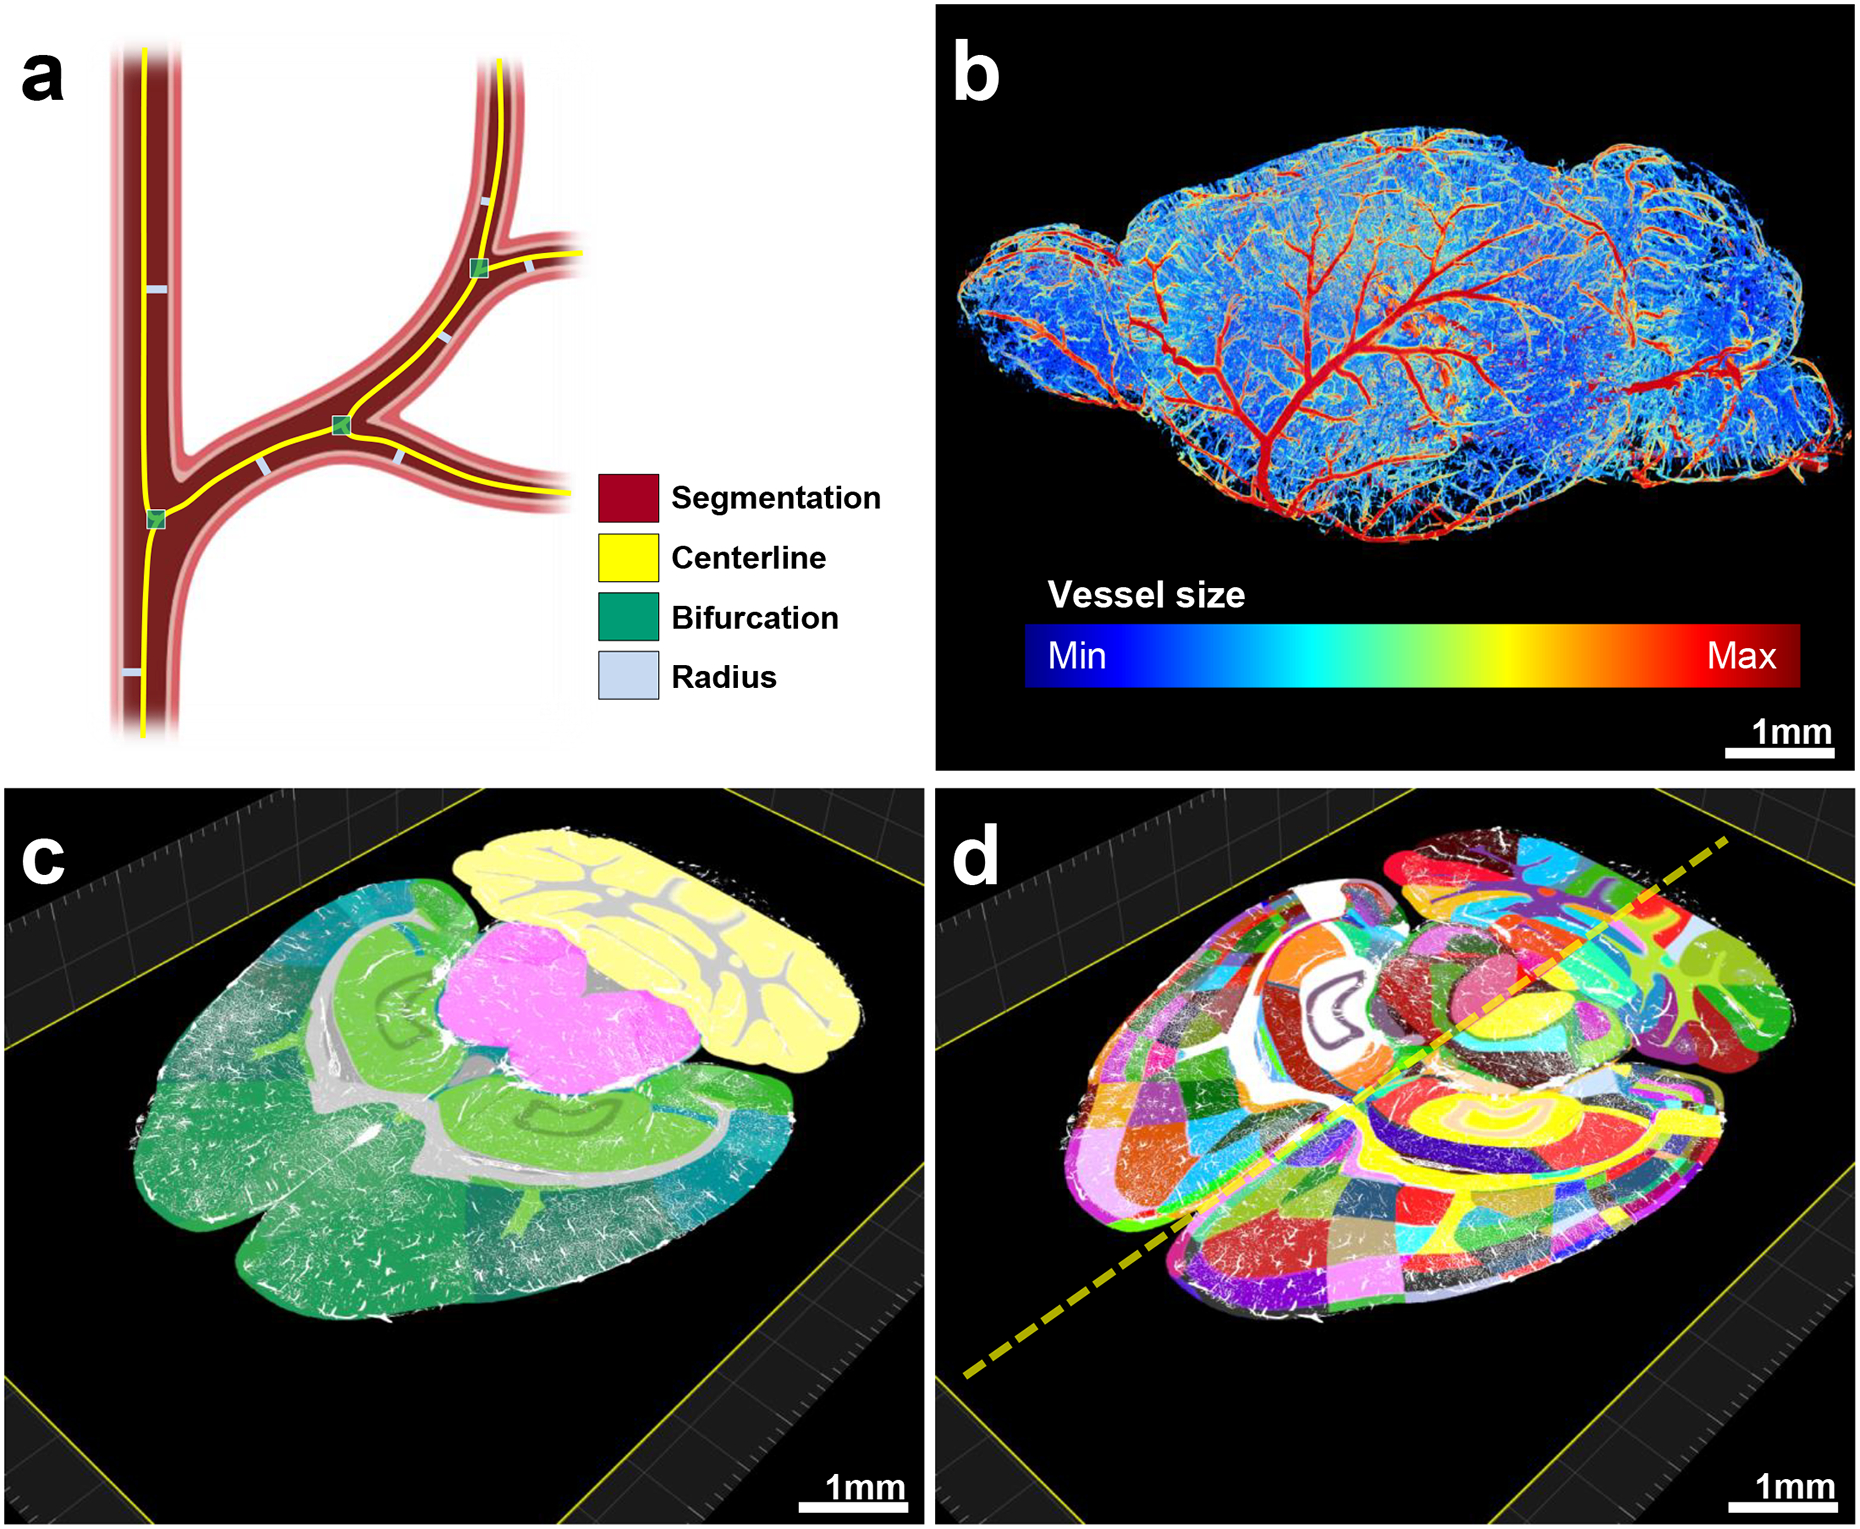
Figure 4 |. Pipeline showing feature extraction and registration process.

a, Representation of the features extracted from vessels. b, Radius illustration of the vasculature in a CD1 mouse brain. C–d, Vascular segmentation results overlaid on the hierarchically (c) and randomly color-coded atlas to reveal all annotated regions (d) available including hemispheric difference (dashed-line in d). The experiment was performed on 9 different mice with similar results.
