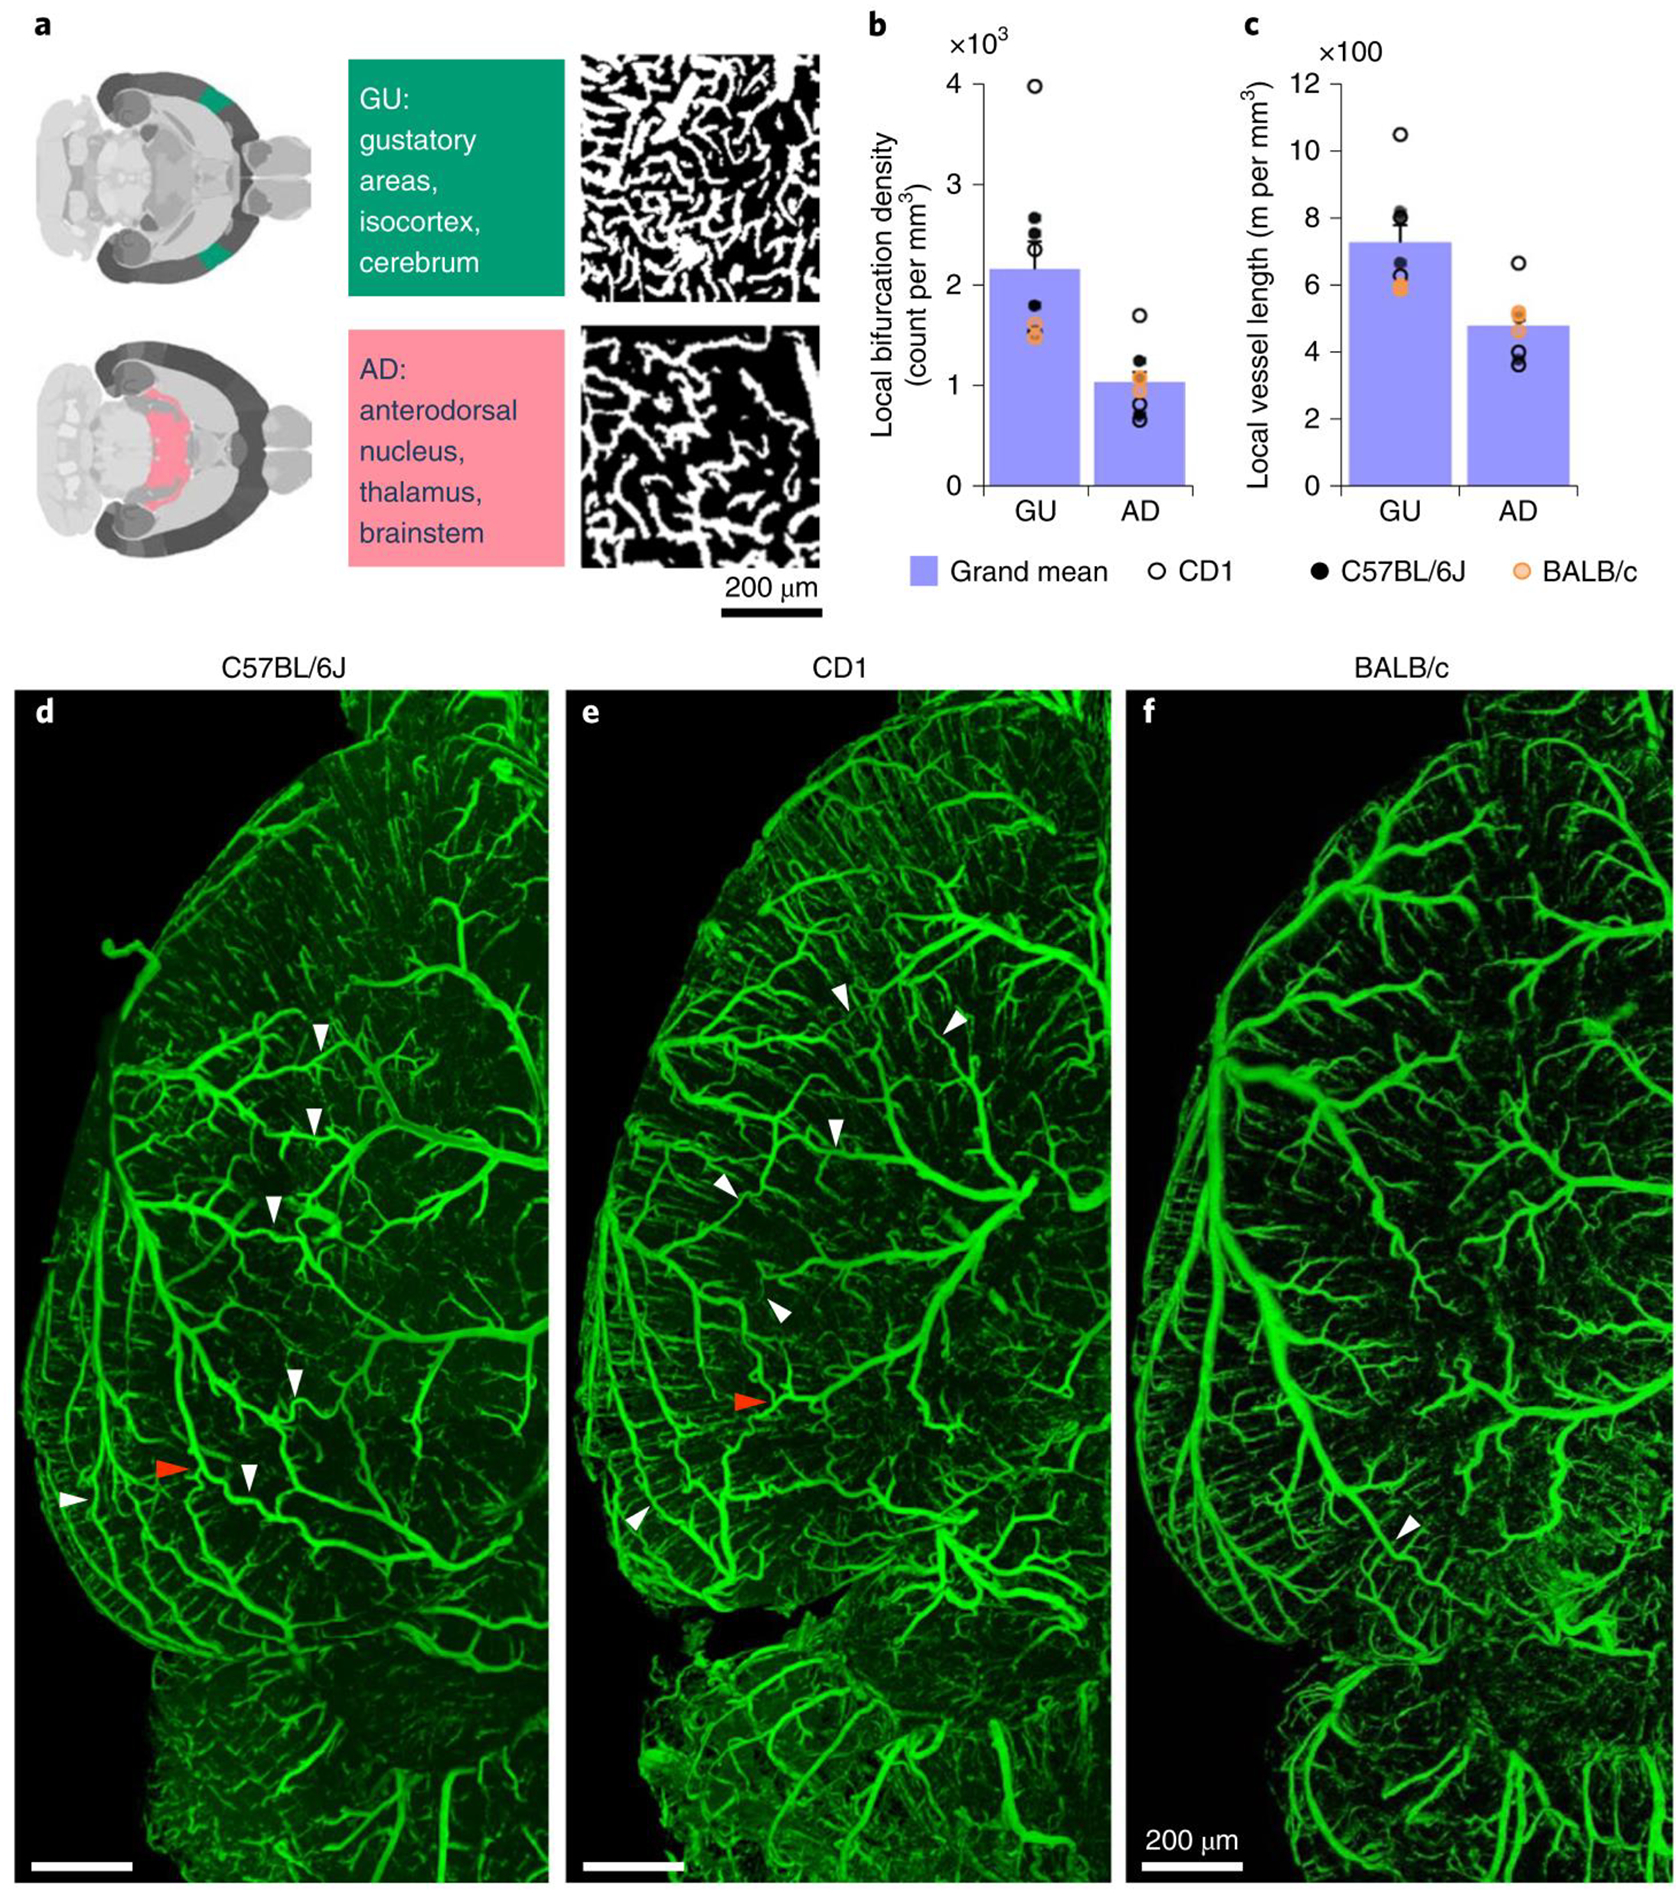
Figure 6 |. Exemplary quantitative analysis enabled by VesSAP.

a, The respective location of AD and GU areas in the mouse brain (left panels), maximum intensity projections of representative volumes from the gustatory areas (GU) and anterodorsal nucleus (AD) segmentation (600 × 600 × 33 μm) (right panels). b, c, Quantification of the bifurcation density and local vessel length for the AD and GU clusters. CD1 mice shown by open circles, BALB/C by orange circles, and C57BL/6J by black circles. Values are mean ± SEM, n=3 mice per strain. D–f, Images of the vasculature in a representative C57BL/6J (d), CD1 (e) and BALB/c mouse (f) where the white arrowheads indicate anastomoses between the major arteries. Direct vascular connections between the medial cerebral artery (MCA), the anterior cerebral artery (ACA) and the posterior cerebral artery (PCER) are indicated by red arrowheads. The experiment was performed 3 times with similar results.
